Monitoring Server Topology
Monitoring Server Topology
This topology shows all the monitoring server components working together. The Monitoring Server, Monitoring Database, the Dashboard Designer and the Dashboard Viewer for SharePoint are all part of the dashboard life cycle.
The monitoring server contains two web sites (Central and Preview web sites) and a web services. The Dashboard Designer is launched from the Central web site. The designer communicates to the monitoring server to build and publish dashboard to the monitoring database. The Dashboard Designer can deploy to the preview web site on the monitoring server to preview a dashboard. The dashboard designer also deploys dashboard to the Windows SharePoint server with the Dashboard Viewer for SharePoint installed, once the dashboard is deployed to the Windows SharePoint server the dashboard can be viewed.
When viewing the dashboard through the Dashboard Viewer for SharePoint Services, the user browses to the SharePoint site clicks on dashboard document and the dashboard starts to render. The Dashboard Viewer for SharePoint Services connects to the monitoring database reads the dashboard definitions that were published to the database and then renders the dashboard. The data in the views is obtained by the Dashboard Viewer for SharePoint Services connecting to the data sources, gathering the data and rendering the view. Notice in this process the Monitoring Server is not involved. Once a dashboard is published to the database and deployed to the Windows SharePoint server the Monitoring Server is not needed to render the dashboard.
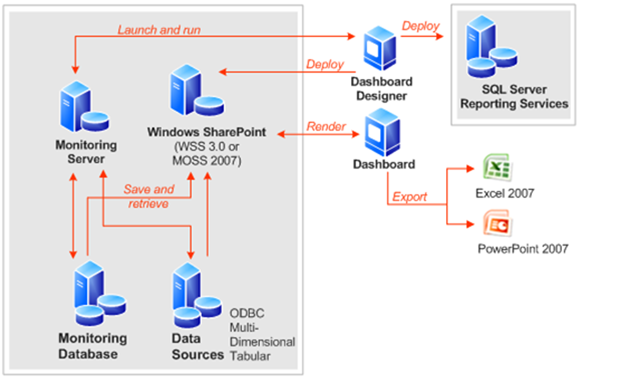
When viewing the dashboard a couple of export features are available, export to Excel and export to PowerPoint. One other feature to note is when building dashboards the designer can deploy scorecard to a SQL Server 2005 Reporting Services server.
Dashboard communicates to monitoring database and the data sources
I would like to reiterate the fact that the Monitoring Dashboard Viewer for SharePoint Services contains all the rendering capabilities. This means when a dashboard is viewed the Dashboard Viewer for SharePoint Services web part reads the monitoring database, connects to the data sources and renders the dashboard. The Dashboard Viewer for SharePoint Services does not communicate with the Monitoring Server. Notice is the diagram the Windows SharePoint system does not connect to the Monitoring Server. Publishing a dashboard to the database and deploying the dashboard to SharePoint gives the Dashboard Viewer of SharePoint Services all it needs to display the dashboard.