Integrating Trend Charts in Dashboards
After you have created your trend charts (see the trend chart creation blog here), you can use them in a dashboard. The trend chart needs to be connected to the scorecard which it is based on in the dashboard designer, linked via the KPI ID to the Row Header in the Trend Chart as follows:
1. Add the scorecard into a zone in your dashboard.
2. Add the trend chart into a zone in your dashboard.
3. In the Available Fields list in the scorecard, drag the KPI ID field and drop it into the input area for the trend chart.
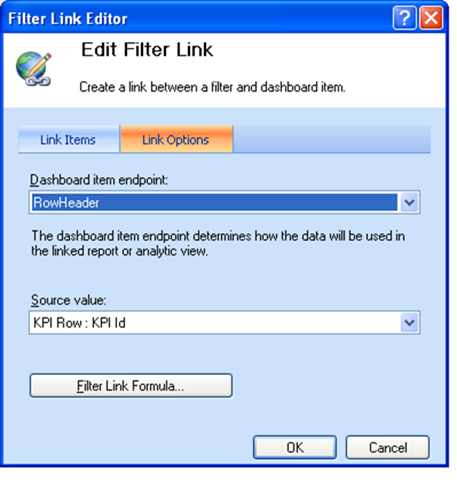
4. Map the Dashboard item endpoint as RowHeader and leave the Source value as KPI Row: KPI Id.
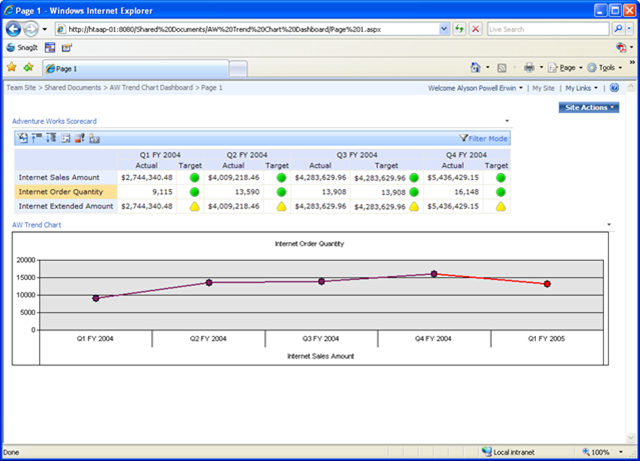
5. Publish your dashboard. Upon selecting each KPI in the scorecard within Sharepoint, the appropriate trend chart for that KPI will be displayed.
Alyson Powell Erwin (alysonp@microsoft.com)