SQL Server Blocked Process Report using SQL Profiler
Today, I learnt something new with SQL Server Profiler while doing performance testing of an internal Microsoft application. It is about SQL Server Blocked Process Report. Using SQL Server Blocked Process report, one can find the portion of the code that is spending most time in blocked state.
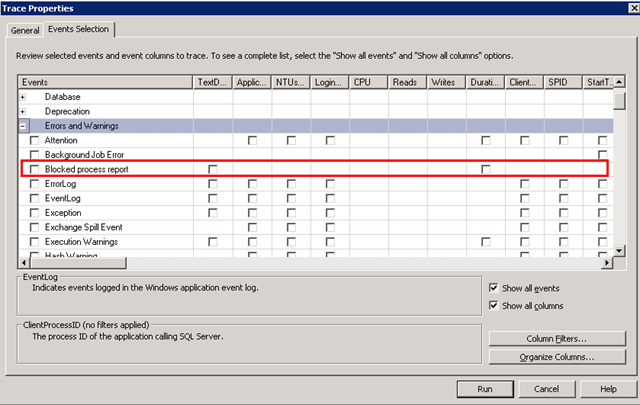
The Errors and Warnings Event has a sub-event called Blocked Process Report in SQL Profiler. Generally, in the traces obtained from SQL Profiler, you won’t notice this event being recorded if you have enabled all the sub-events under Errors and Warnings. This is because by default Blocked process report event is disabled on the SQL Server.
To turn-on the Blocked Process report on the SQL Profiler, run the following commands.
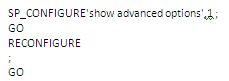
This will turn-on the advance options. Now, run this command to turn-on the Blocked process report.
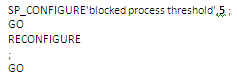
The threshold value indicates the sampling interval between two successive blocked process reports i.e. it shows how often do you want to generate the successive blocked process report. In our case, we have selected 5 seconds.
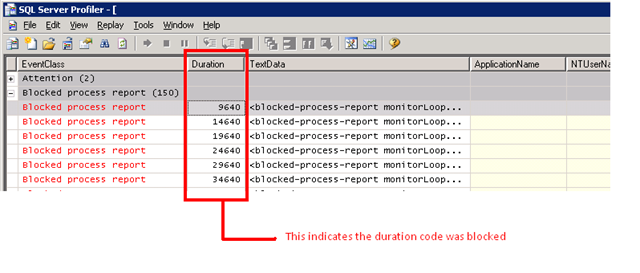
The text data of the blocked process report contains the blocked code and other related details in XML format. To know more details about Blocked process report, go through this excellent article by Brad McGehee on identifying blocking problems with SQL Profiler.