WPF Debugging in VS
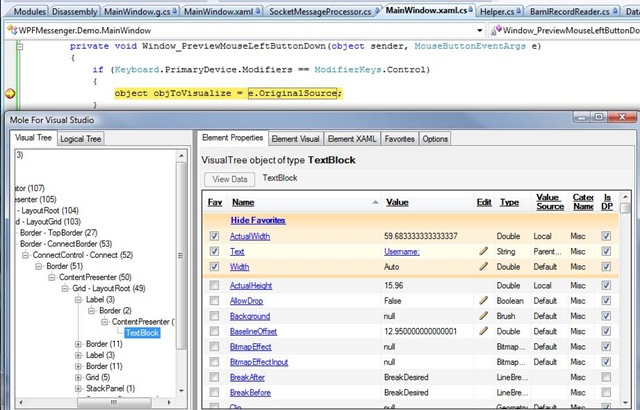
If you ever debug WPF elements or use the QuickWatch feature in VS, I suggest you try out Mole. It’s a visualizer similar to Snoop, allowing you to view the visual/logical trees, as well as an extended set of properties, directly from VS.
I was particularly impressed by the number of cool features, such as being able to add “favorite” properties to debug (always annoying in VS to have to scroll) or being able to dynamically view a collection’s items in a data grid. You can also get a visual representation of the element you're debugging, as well as its Xaml. It is also reported to work with XBAPs, although I haven’t tried that.
Install:
- For X64: Copy the assembly to %ProgramFiles(x86)%\Microsoft Visual Studio 9.0\Common7\Packages\Debugger\Visualizers
- For X86: Copy the assembly to %ProgramFiles%\Microsoft Visual Studio 9.0\Common7\Packages\Debugger\Visualizers
Usage:
After setting a breakpoint near a WPF element, you should be able to highlight the object and click on the magnifying lens icon. To make this easier, you can temporarily add a PreviewMouseLeftButtonDown event to your top-most window and Ctrl-Click an item.
You can find videos and more documentation here.
Screenshot: