Troubleshooting Application Compatibility Issues – Tools, Tips, and Tricks
When I need to troubleshoot a compatibility problem, there are a handful of tools that I use that are very helpful. In this post, I’ll talk about some of my favorite tools and how to use them to identify compatibility issues.
Most applications do a poor job of reporting unexpected errors. A lot of times, the developer didn’t plan for the error and it gets bubbled up as a misleading error or a crash to the user. Compatibility issues tend to fall in the unexpected category. I’ve categorized the usual causes of these expected issues and the troubleshooting tools I use.
UAC: Permission Issues
Application compatibility permission issues are usually a result of applications not being designed for standard user. The application assumes that the user has full administrator privileges and has issues running with User Account Control (UAC) enabled.
Process Monitor is the first tool you should use in identifying a possible permission issue. Process Monitor logs all file and registry activity (among other things). This can be very handy when looking for a permission issue.
Start Process Monitor prior to the issue occurring. Make sure you are capturing at least the file and registry activity.
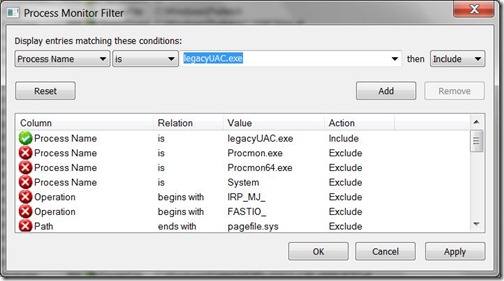
Since this tool logs everything that is happing on the system, make sure to take advantage of the filtering feature. You may want to filter on PID or Process Name. For example, I’m only including the process name “legacyUAC.exe”.
Tips:
- You probably have a good idea about what file or registry is giving you a problem. You can use the “find” function
 to find the file or key.
 - Permission issues tend to return a status of “ACCESS DENIED”. Try adding a filter for “Result is ACCESS DENIED”:

- UAC virtualization will be indicated by a result of “REPARSE” followed buy a log entry to the virtual store location. See this post for details on UAC virtualization.
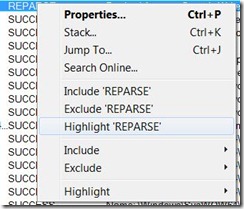
- Sometimes highlighting can be more useful than filtering. For example, you may want to see the log entries that occur around the same time as another log entry. REPARSE is a good example. Highlighting works like filtering. You can get to the highlighting dialog from the menu. A shortcut to add highlighting (and filtering) is to right click on the column/row and add the highlight condition.
UAC: Integrity Level Issues
If you have applications that communicate to other processes especially via Windows messages, you may run into Mandatory Integrity Level (MIC) issues.
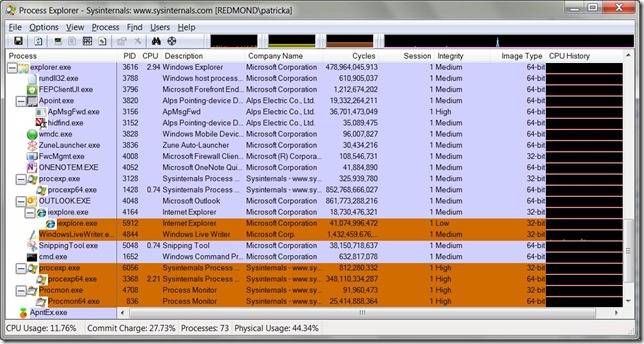
Process Explorer is a great tool for a lot of troubleshooting tasks. If you need to see at what integrity level a process is executing, Process Explorer has a column that reports the integrity level of running processes. Simply check “Integrity Level” under View | Select Columns… in the menu. Here’s an example screenshot:
Version Checking Issues
Version Checking issues are a very common compatibility issue. Applications will check the OS version and make decisions on whether to run or exit, use certain APIs, perform functionality, etc. Depending on how the version check logic is written, the code may make an incorrect choice on a new OS Version.
Application Verifier is one of the best tools to “lie” about the OS version to an application. Application Verifier intercepts Windows version API’s and returns any version number you want to specify. So, if I’m having an issue, I can set the version number to a previous OS to verify I have a version checking issue.
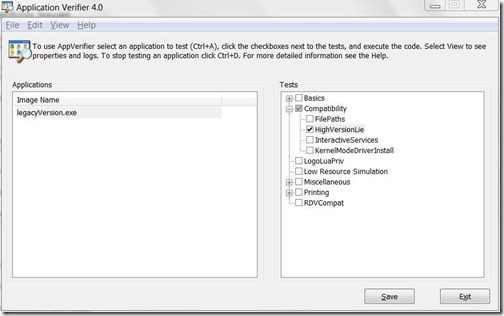
Just add your application to the application list Application Verifier will monitor and test. Check the HighVersionLie test only for version checking. Application Verifier has a lot of test that focus on reliability. You may get unexpected crashes if you do some of the default memory tests.
By default, the HighVersionLie test increments the major and minor OS version numbers by 2. Windows 7 is version 6.1. Therefore, you application will think it’s running on OS version 8.3. Here’s sample output from my legacyVersion sample app:
>legacyVersion.exe
OS Version using GetVersion (Major.Minor.Build): 8.3.8600
OS Version using GetVersionEx (Major.Minor.Build): 8.3.8600
MajorVersion==5 is FALSE. I'm NOT Win2000 or XP
MajorVersion==5 && MinorVersion==1 is FALSE. I'm NOT XP
MajorVersion==6 is FALSE. I'm NOT Vista
MajorVersion==6 && MinorVersion==0 is FALSE. I'm NOT Vista
MajorVersion>=5 && MinorVersion>=1. I'm XP or greater
*** Most correct version check ***
MajorVersion>=6 && MinorVersion>=0. I'm Vista or greater
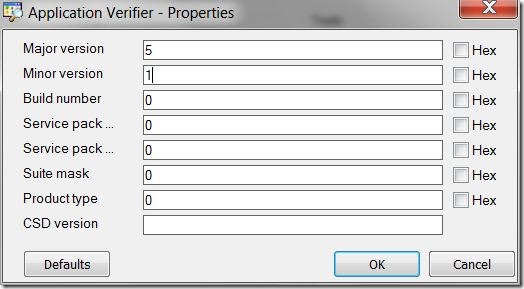
If you want to test some other version number, right click the HighVersionLie test and select properties. Enter the version you want to test:
Note: Application Verifier always attaches to the applications in its list regardless if the UI is active. Remember to delete the application from the list when you are done troubleshooting.
The nice thing about Application Verifier is that you can set the version number to anything. This can be useful in determining if your app has any version checking issues on a future OS. By default, the HighVersionLie test increments both the major and minor version numbers by 2.
Checking Manifests
Sigcheck is a signature checking tool. However, the –m switch allows you to dump the manifest. This is a quick way to see an application manifest for an executable.
The application manifest is a resource in the executable. You can also use a resource editor to view the manifest. With a resource editor, you could also modify the manifest which could help in debugging the issue. For more information on manifests, see my manifest post.
Performance
If you are trying to uncover a performance issue, Process Explorer can help you narrow down the issue quickly. I run Process Explorer with the system tray icons. This allows you to monitor thumbnail performance graphs for the system. If you notice a high value or spike, you can hover over the icon and get a possible clue of what might be causing the issue. In this screenshot, you can see I hovered over the CPU icon and we see the suspicious application CPUHog.exe consuming 49% of the total CPU.
To turn on the tray icons, select the icons you would like to see from the Options menu.
Another handy performance option in Process Explorer is to use the CPU History columns This will show the CPU history graph for all processes. This can be useful if you have intermittent CPU spikes. Just add the CPU History column in the View | Select Columns menu.
If you need advanced performance analysis, you can use XPerf in the Windows Performance Toolkit (WPT). XPerf allows you to capture and view Windows event data for everything that is going on in the operating system. This is a very powerful tool that you can obtain very detailed information. It may take some practice before you get proficient with this tool.
Boot Performance
If you are encountering slow boot times, you may need to analyze what is in the boot path to pinpoint the problem. Process Monitor provides a quick and easy way to log boot time activity.
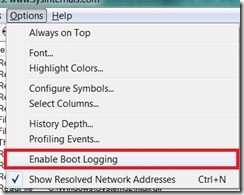
Select Options | Enable Boot Logging
This will log the file, registry, profiling information during your next boot. You can then review the log to identify possible applications that are consuming a lot of resources during the boot cycle.
If you are interested in in depth boot performance analysis, you can use the Windows Performance Toolkit (WPT). See the Windows On/Off Transition Performance Analysis whitepaper for details on how to use WPT to analyze boot performance.
Crashes
For crashes, you will need to use a debugger. I generally use WinDbg.
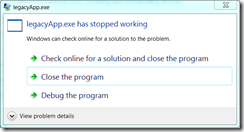
If you can reproduce the crash, don’t dismiss the crash dialog. By leaving the dialog, the process still exists and you can attach to the process with the debugger and diagnose the exception.
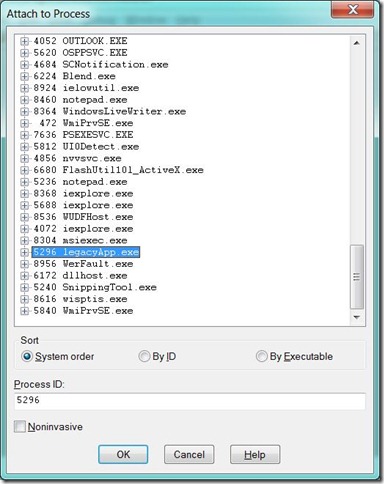
Press F6 and attach to the process.
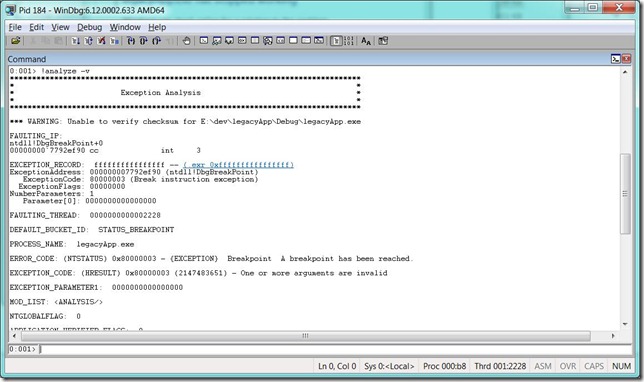
Ideally, you can load your symbols at this point. If you have debug symbols for the application, the debugger can give you more information about the exception. Once you have your symbols loaded, try a !analyze –v command. The debugger will try to give you some analysis of the exception.
In this case, it looks like we have an invalid argument.
Saving dumps
Sometimes, you may want to save dumps for analysis later. Maybe it’s on a non-development machine or you want to collect several dumps. You can configure Windows 7 and Windows Server 2008 R2 to always generate and save a dump file.
- Create a key named: HKLM\Software\Microsoft\Windows\Windows Error Reporting\LocalDumps
- Dumps will default to the following directory: %LOCALAPPDATA%\CrashDumps
- You can override the default with a DumpFolder value (REG_EXPAND_SZ)
- You can also limit the number of dumps saved with a DumpCount value (DWORD)
For more info see: https://blogs.technet.com/b/askperf/archive/2008/02/05/ws2008-windows-error-reporting.aspx
What about Hangs?
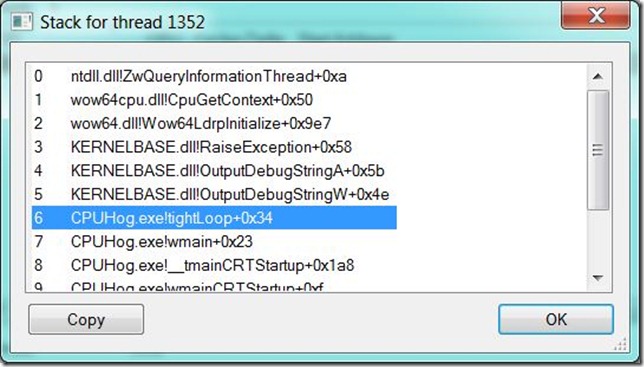
For hangs, the first tool I uses is Process Explorer. If an application is slow and unresponsive, I start Process Explorer and use crosshair on the toolbar and drag and drop on to the unresponsive window. This will highlight the process in the list. I then double click the process in the list and then look at the Threads tab. You can then double click the threads to look at the stack. This usually points you in the right direction. Here we can see that in CPUHog.exe, the tightLoop routine is probably a good place to start looking for an issue:
Error codes
Sometimes it’s easy to forget that there’s a tool to look up error codes. Err.exe in the SDK. This utility can be used to look up what the description for a particular code. Err.exe uses error codes defined in header files. It exists in the Bin directory of the SDK. e.g. C:\Program Files\Microsoft SDKs\Windows\v7.1\Bin.
For example, let’s look up error code 5.
C:\Program Files\Microsoft SDKs\Windows\v7.1\Bin>err 5
# for hex 0x5 / decimal 5
BTH_ERROR_AUTHENTICATION_FAILURE bthdef.h
INVALID_PROCESS_ATTACH_ATTEMPT bugcodes.h
CDERR_LOADSTRFAILURE cderr.h
CR_INVALID_DEVNODE cfgmgr32.h
DHCP_DROP_UNAUTH dhcpssdk.h
LLC_STATUS_PARAMETER_MISSING dlcapi.h
HIDP_GETCOLDESC_PREPARSE_RESOURCES hidpddi.h
IAAPI_TOOBIG iaapi.h
# /* Value exceeds size constraint */
MD_ERROR_SUB400_INVALID_TRANSLATE iiscnfg.h
MD_ERROR_SUB401_APPLICATION iiscnfg.h
MD_ERROR_SUB403_SSL128_REQUIRED iiscnfg.h
MD_ERROR_SUB404_URL_SEQUENCE_DENIED iiscnfg.h
MD_ERROR_SUB503_CONNECTION_LIMIT iiscnfg.h
IME_RS_TOOLONG ime.h
# given string is too long
KDC_ERR_S_OLD_MAST_KVNO kerberr.h
# 5 Server's key encrypted in old master key
RSVP_Err_BAD_STYLE lpmapi.h
# /* Conflicting style */
POLICY_ERRV_IDENTITY_CHANGED lpmapi.h
POLICY_ERRV_SUBNET_DEF_FLOW_COUNT lpmapi.h
MAPI_DIAG_MAXIMUM_TIME_EXPIRED mapidefs.h
SE_CATEGID_DETAILED_TRACKING msaudite.h
# Detailed Tracking
MSIDBERROR_UNDERFLOW msiquery.h
# data less than minimum value allowed
NRC_CMDTMO nb30.h
# /* command timed out */
NDDE_INVALID_SHARE nddeapi.h
NMERR_NO_MORE_FRAMES netmon.h
SMART_INVALID_DRIVE ntdddisk.h
# Drive number not valid
DS_NAME_ERROR_DOMAIN_ONLY ntdsapi.h
SAM_PWD_CHANGE_NOT_COMPLEX ntsam.h
ODBC_ERROR_INVALID_REQUEST_TYPE odbcinst.h
OLE_ERROR_STREAM, ole.h
# (OLESTREAM) stream error */
MFE_OIF_PRUNED routprot.h
# no downstream receivers exist on oif
SCESTATUS_BUFFER_TOO_SMALL scesvc.h
SE_ERR_ACCESSDENIED shellapi.h
# access denied
SNMP_ERRORSTATUS_GENERR snmp.h
SNMP_GENERICTRAP_EGPNEIGHLOSS snmp.h
TWCC_OPERATIONERROR twain.h
# /* DS or DSM reported error, app shouldn't */
CMC_STATUS_CONFIRM_REQUIRED wincrypt.h
CMC_FAIL_UNSUPORTED_EXT wincrypt.h
ERROR_ACCESS_DENIED winerror.h
# Access is denied.
LDAP_COMPARE_FALSE winldap.h
SNMP_ERROR_GENERR winsnmp.h
# as an HRESULT: Severity: SUCCESS (0), FACILITY_NULL (0x0), Code 0x5
# for hex 0x5 / decimal 5
ERROR_ACCESS_DENIED winerror.h
# Access is denied.
We can see there are lots of definitions for the error code of 5. Depending on what header files you include in your code, you can figure out what the actual error is. If you don’t have access to the code, you can usually make an educated guess on which error you are encountering.
I hit on most of the tools I use to solve most of the issues I’ve seen. I really hope this helps you find issues and be able to solve them.
Pat

