What is Visual Studio's 2012 Code Map All About?
What is Code Map?
Back in Nov 2012, in Visual Studio 2012 Update 1 a new feature named Code Map was introduced in Ultimate edition. The feature allowed visualization of relationships in code. Here’s a short video that will help you understand the concept behind Code Map.
Beginning Visual Studio 2012 Update 2, Microsoft has extended Code Map with debugging support allowing us to visualize code relationship as you step through the code in debugging session. Consider the Windows Phone code below where on a button click event a call is made to a web service to request population for Pakistan. Once the result is obtained a confirmation message is shown to the user. However during testing we identified that the confirmation message is shown before the response is actually retrieved so we’ll debug the code with Code Map to evaluate the issue.

Code Map: How To?
To explore Code Map debugging feature, set the breakpoint on Button click handler and as soon as the breakpoint is hit, bring forth the code map window by either of following,
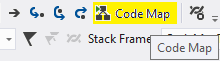
- By selecting Code Map button from toolbar
- Choosing Show Call Stack on Code Map from Debug menu
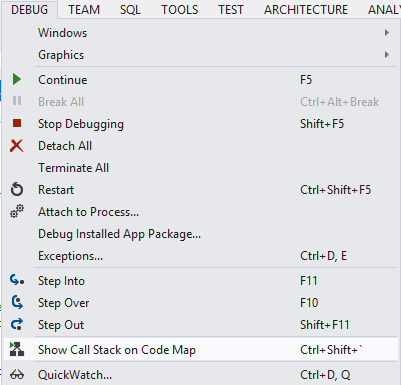
- Pressing Ctrl + Shift + `
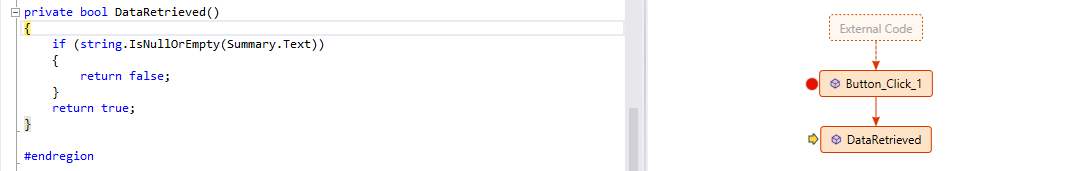
You’ll see something like this,
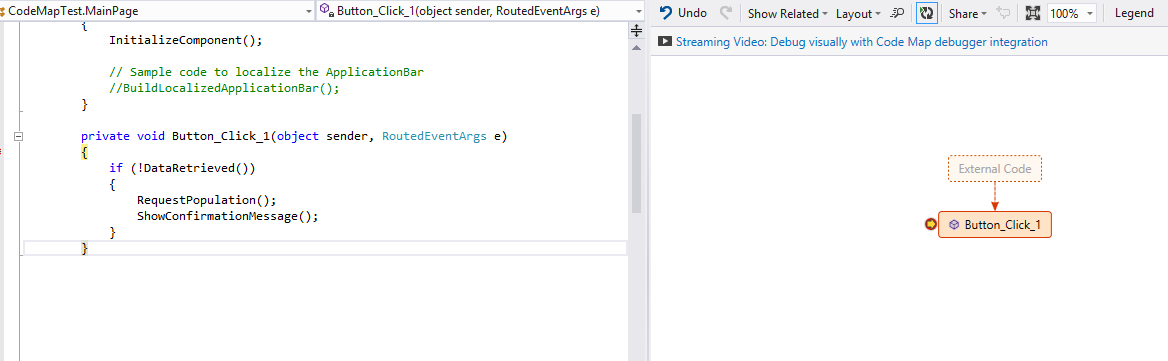
The red border around node denotes which nodes are in the active context of debugging. How about step into our first method? Pressing F11 will take you inside the method DataRetrieved() and Code Map will reflect your debugging state by creating a new node for corresponding method. Notice that node for DataRetrieved() is in focus as identified by yellow marker.  This way you can keep track of your call stack and easily track the relationship of methods.
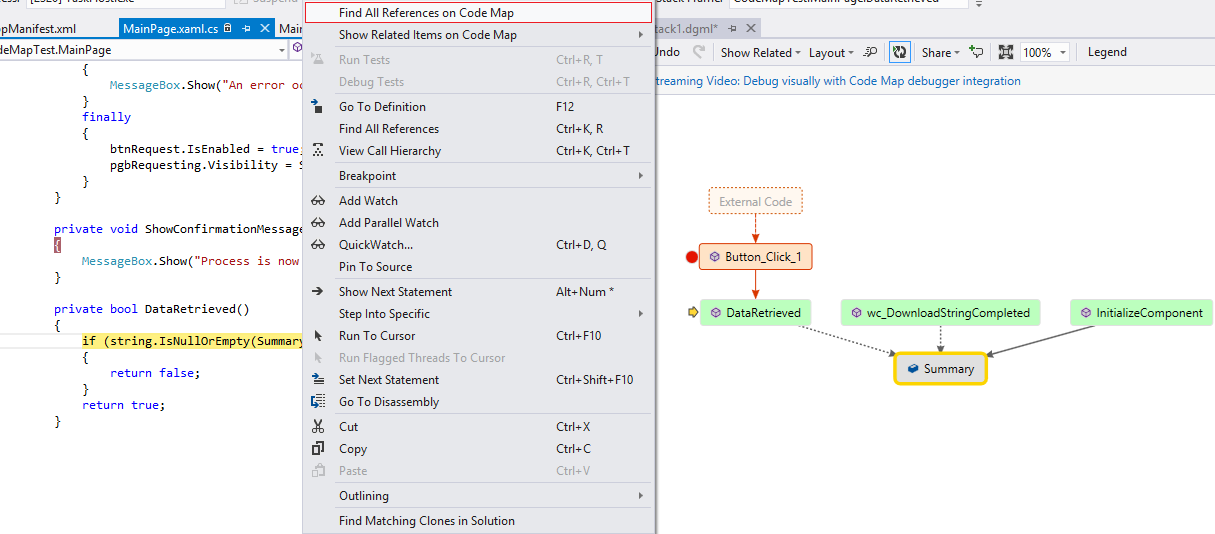
Just to gain insight into power of Code Map, if you click on Summary (TextBlock) inside the method and select ‘Find All References on Code Map’ the Code Map window will reflect the references of the field. This is also handy and in my humble suggestion more insightful when you need to identify which methods in your code play with a particular field and can help in intricate debugging scenarios.
If you continue debugging through the method and reach back to Button click handler’s next method in line RequestPopulation() you’ll notice that if you skip this method by pressing F10 (don’t stop into) CodeMap doesn’t reflect this method. This ensures that Code Map is not cluttered and only presents what you are interested in evaluating.
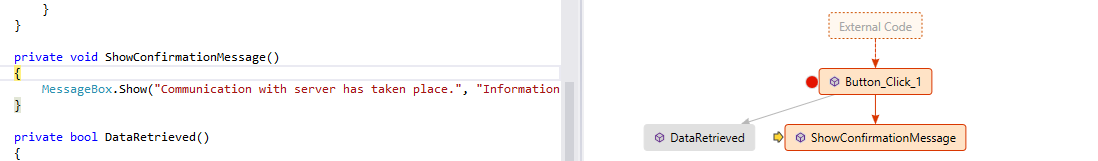
Let’s step into the last method in this call ShowConfirmationMesssage() and you’ll notice that while node for this method gets active, the node for DataRequest() method also changes color to gray yielding that this method is no more in active context of debugging.
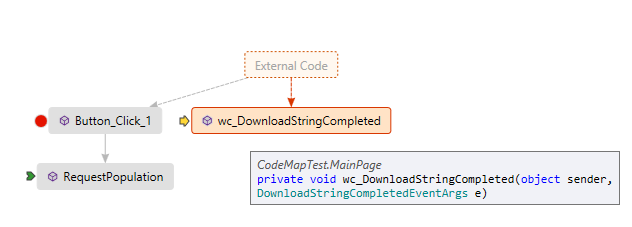
Lastly if we step through this method, reach back to Button 1 click handler and continue debugging through F10, we’ll notice that we step into DownloadStringCompleted event which was an asynchronous call made from RequestPopulation() method. Notice that the Code Map shows this as a branch from External Code node since that call was taken over by Windows Phone core class libraries (System.Net.WebClient class).
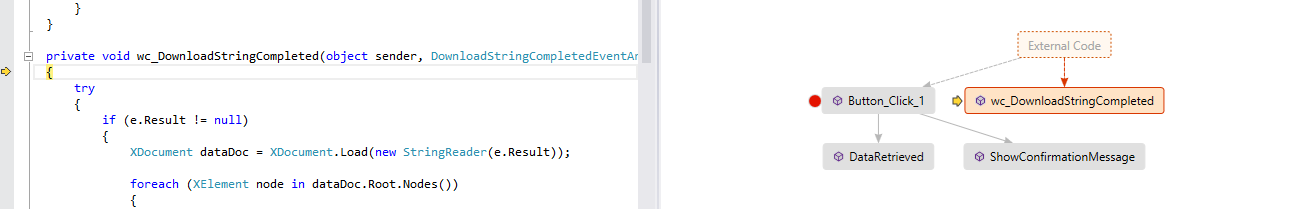
Mouse over the node wc_DownloadStringcompleted() event and you’ll see the relevant code signature in tooltip.
Code Map Reviewing Features
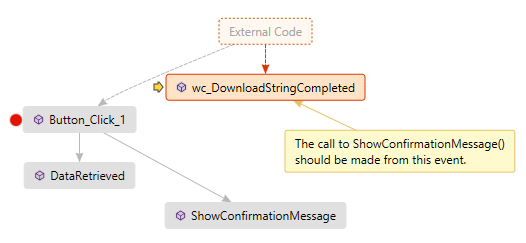
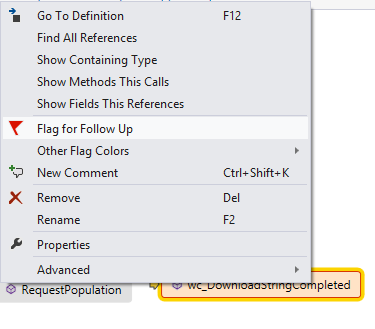
We finally see the issue with code. The call to web service is asynchronous and thus the code doesn’t wait for the response and shows the confirmation message prior. This identification must be shared with our developer. Code Map is particularly useful for review purposes. Right click on the wc_DownloadStringCompleted event and select add comment.
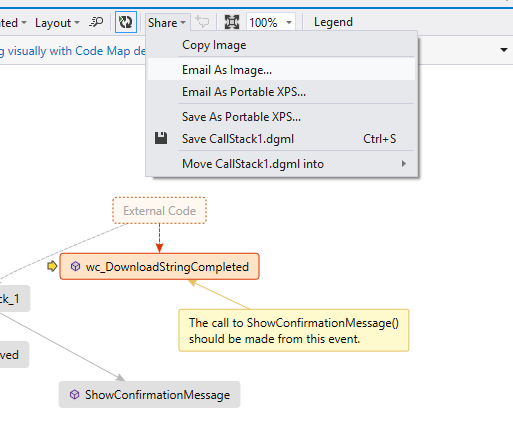
After adding comment you can simply go the top and select share method of your choice.
You’ll also find other useful features like ‘Flag for Follow Up’ which highlights the node with colors of your choice and is easy if you identify a section of code that requires your attention but is secondary during this debugging session.
Pointers Review
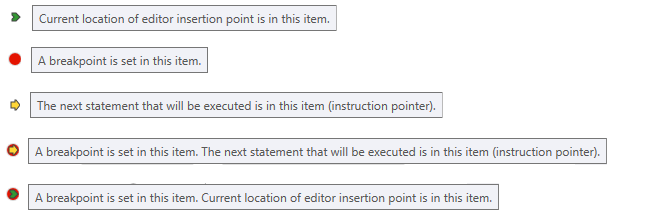
Finally for reader’s ease, here’s a quick review of pointers that you see analogous to nodes in Code Map,