OOXML SmartArt Pie Chart Construction
OOXML SmartArt Pie Chart Construction
In recent years, vector graphics have become much more preferable due to the various display systems encountered. Thus, images could be resized without fear of quality loss. SmartArt works in a similar fashion. To illustrate this, I am going to show the construction of a basic pie chart in Word 2010 as an example.
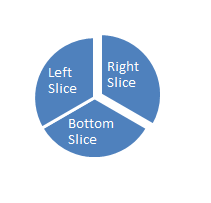 The graphic displayed above is an example of a basic pie chart with 3 slices. All 3 slices shown are constructed via XML.
To fully understand the construction of a smartart pie chart, an understanding of geometry is necessary. What do we know about a pie? It represents a geometric shape which happens to be a circle. What do we know about circles? How do we map a point on a circle? We can find definitive points on a circle given a unit of angular measurement. There are 2 widely used such measurements: radians and degrees. However, for our purposes, we are going to use the degree measurement as this is the measurement used by the current standard.
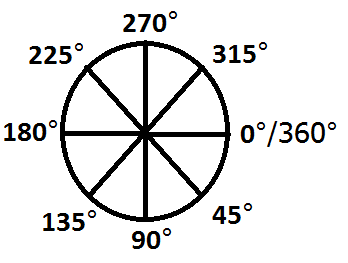 Note: 0° and 360° refer to the same point.
Illustrated above is our reference circle to explain the basics of construction. Think of this as a race. You have a starting point and an ending point. Given 2 points of reference, you can calculate the length between both points. This is how the slices of the pie are constructed. We provide a starting point and ending point by using the degrees unit of measurement. The direction of marking along the circular path is clockwise with 0/360 being our reference point. Therefore, to create a slice that is half of the circle (the top half); we provide the numerical values 180 and 360. 180 will be our starting point with 360 being the end of the angle.
The following 2 graphics illustrate this slice measurement. The graphic on the left shows the area of interest shaded, while the second shows the slice that would appear in Word 2010:
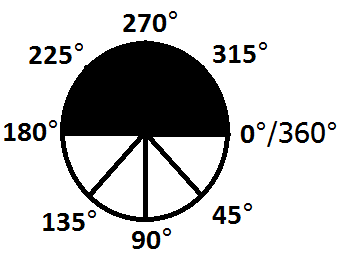

These values are contained in groups of two called shape adjust values. These values are sub-elements found underneath a serialized shape object (XML Element: dgm:shape) and are identified by a shape adjust index (idx), which uniquely identified the starting and ending points; with the shape adjust index idx1 being the starting point and idx2 being the ending point.
Please note that the information presented in this blog is not currently in the [MS-ODRAWXML] Specification document but should be included in a future release of the documentation.
References
[MS-ODRAWXML]: Office Drawing Extensions to Office Open XML Structure
Specifies extensions to the DrawingML OOXML File Format Structure, which is used in WordprocessingML, SpreadsheetML and PresentationML documents.