Transitioning from Microsoft Exchange RPC Extractor (RPX) to Microsoft Message Analyzer
The Microsoft Exchange RPC extractor (RPX), which is used to isolate Exchange RPC/ROP data from other data in a network capture and make this isolated data available for viewing, has been around for several years and will soon be retired. Microsoft Message Analyzer is a new tool that will eventually replace both Microsoft Network Monitor (Netmon) and RPX.
The newly developed Exchange MAPI parsers for Message Analyzer enable Message Analyzer to achieve the same function as RPX, but Message Analyzer has far more capabilities than RPX has. The general differences between RPX and Message Analyzer are listed in the following table.
Exchange RPC Extractor (RPX) |
Message Analyzer |
|---|---|
Runs from the command line. |
Runs from Windows. |
Does not capture network traffic, only parses. |
Captures and parses network traffic. |
Outputs the parsed data into a text file for viewing. |
Displays the parsed data in a graphical user interface (GUI). |
Removes details of all protocols except Exchange MAPI over RPC. |
Allows viewing and analysis of all network traffic that was captured and includes all protocols in a message's protocol stack. |
Requires that the user scroll through plain text (in the RPX output text file) to view the frames. |
Provides features that make it easier to view frames or data of interest. |
It is important to note that Message Analyzer can capture and parse protocol packets, whereas RPX is simply a parser. RPX parses a network capture file (.cap), which was created by Netmon, and outputs the details of the parsed Exchange RPC/ROP packets into a text file. Viewing the Exchange RPC/ROP packets requires the user to scroll back and forth, as needed, through the text file; the user must do a search of the text to find specific data of interest. In contrast to RPX, Message Analyzer provides a graphical display of data and other features that make viewing and analyzing easier.
To familiarize RPX users with Message Analyzer and demonstrate the advantages of Message Analyzer over RPX, this article focuses on the following topics:
- Getting a top-level view of Exchange RPC/ROP traffic
- Viewing details of a particular RPC/ROP packet
- Organizing and isolating specific RPC/ROP messages of interest
- Following a sequence of operations that are related to a specific task
- Identifying and examining errors on messages
By default, every Message Analyzer installation is provided with a baseline set of Open Protocol Notation (OPN) parsers that enable the Protocol Engineering Framework (PEF) runtime to decode messages. To enable decoding of Exchange RPC/ROP messages, you must download the Exchange MAPI parsers after you install Message Analyzer. To download these parsers, select Asset Manager from the Tools menu. On the Downloads tab of the Asset Manager, select Exchange MAPI Parsers and click the download icon.
This article, which is intended to introduce RPX users to Message Analyzer and ease the transition to this new tool, touches on only a few of the features of Message Analyzer and provides brief steps for applying these features. Consult the Microsoft Message Analyzer Operating Guide for complete details about all of the features of Message Analyzer and to fill in any gaps about how to apply the features discussed in this article.
Getting a Top-level View
To get a top-level view of Exchange RPC/ROP traffic in Message Analyzer, you can use the Analysis Grid viewer. This viewer, which is the default data viewer in Message Analyzer, displays the messages in a grid configuration of columns and rows with each message on a separate row. Each row in the grid is a parent node with child nodes. The top-level protocol (or module) that is used for a message is represented as the parent node, while the underlying protocols in the message's protocol stack are represented as the child nodes.
A screenshot of a trace of Exchange RPC/ROP traffic, as it is displayed in the Analysis Grid viewer, is shown in Figure 1. Only the first eight Exchange RPC/ROP messages are shown. This view has the eight message parent nodes collapsed. A parent node can be expanded by clicking the "+" at the beginning of the row. The frame number (or message number, as it is called in Message Analyzer) is in the first column.
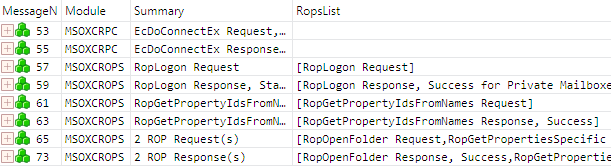
Figure 1: Top-level view of Exchange RPC/ROP traffic as shown in the Analysis Grid viewer
The Analysis Grid viewer has a default layout of eight columns, which include the MessageNumber, Module, and Summary columns, but you can add or remove columns, as needed, to display only the data of interest. In the grid layout shown in Figure 1, I've removed five of the default columns and added the RopsList field ([MS-OXCROPS] section 2.2.1) as a column. When the ROP input buffer or ROP output buffer contains multiple ROPs, as is the case in frames 65 and 73, the Summary column does not specify which ROPs are included in the buffer. A column showing the contents of the RopsList field provides this information.
Any field of the RPC or ROP packet can be added as a column in the Analysis Grid viewer to allow quick viewing of the field values. Furthermore, Message Analyzer provides sets of global properties and global annotations that can be added as columns in the Analysis Grid viewer. You can add a field by right-clicking on the field in the Details window (this window will be discussed in the next section, Viewing Details of an RPC/ROP Packet) and selecting the Add Column for '<FieldName>' from the menu, where FieldName is the actual name of the field.
The screenshot in Figure 2 shows frame 57 with the parent node and all of its child nodes expanded to expose all of the underlying protocols (or providers) in the protocol stack for the RopLogon request ([MS-OXCROPS] section 2.2.3.1.1). You can also view the protocol stack by right-clicking on a row, selecting Show Details from the menu, and selecting the Stack tab.
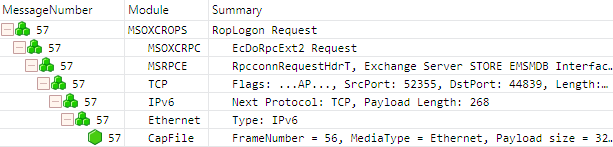
Figure 2: Expanded nodes showing the underlying protocols for the RopLogon request
The Analysis Grid viewer provides numerous functions that enable you to organize and isolate messages to aid analysis. These functions, which will be discussed later in this article, include sorting, filtering, and grouping.
You can save your layout of the Analysis Grid viewer by using the Layout drop-down menu. You can also create multiple views of a trace by using the New Viewer drop-down menu. Each view has its own tab in Message Analyzer. The ability to have multiple views is useful, for example, if you want to view your trace with a different layout of columns or with a different set of filtered messages.
Although this article discusses only the Analysis Grid viewer, Message Analyzer provides several other data viewers. For details about the other data viewers and for details about other functions provided by the Analysis Grid viewer, consult the operating guide.
Viewing Details of an RPC/ROP Packet
In an RPX file, the details of an ROP are displayed in plain text. The screenshot in Figure 3 shows the details for one frame as they appear in the RPX file — brackets, numbers, and highlighting have been added to mark the various parts for easy reference. To conserve space, long lines of text are not completely shown in the screenshot. This frame contains an RopOpenFolder response ([MS-OXCROPS] section 2.2.4.1.2), which, as with all ROP responses, is contained in the rgbOut field of the EcDoRpcExt2 RPC method ([MS-OXCRPC] section 3.1.4.2).
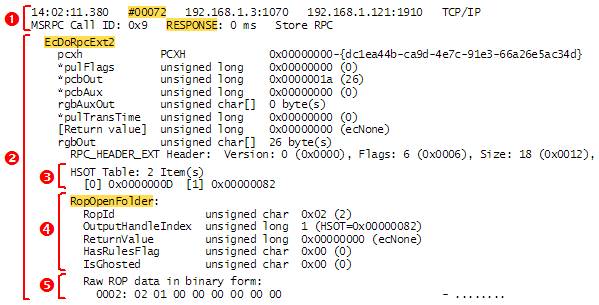
Figure 3: Details of a frame/message as they appear in an RPX output text file
The following numbered items describe the various parts that are identified in Figure 3. The numbers of these items correspond to the numbers in the figure:
- This part includes the frame/message number and the message type descriptor (request/response), which are highlighted.
The other details in this part pertain to the message's lower-level protocols: The call ID, the MSRPCE layer; the TCP source/destination ports (1070 and 1910), the TCP layer; the IPv4 source/destination addresses (192.168.1.3 and 192.168.1.121), the IPv4 layer. - This part consists of the name (highlighted) and the fields of the RPC method. Note that the rgbOut field contains the RPC header along with parts #3 and #4.
- This part consists of the server object handle table, which is called the HSOT Table in the RPX file.
- This part consists of the name (highlighted) and the fields of the ROP request/response.
- This part consists of the raw data of the ROP request/response. (This is just part 4 shown as unparsed bytes of data.)
Viewing these same parts in Message Analyzer depends on which parts you want to view. The frame number, message type descriptor, and names of the RPC method and ROP, all of which are highlighted in Figure 3, are displayed in the MessageNumber and Summary default columns of the Analysis Grid viewer, as shown in Figures 1 and 2 of the previous section, Getting a Top-level View. To view the other parts that are identified in Figure 3, you can either display a Details window or include fields of interest as columns in the Analysis Grid viewer.
To display a Details window for any protocol in a message's protocol stack, select the message row in the Analysis Grid viewer (expand nodes as needed to select a lower-level protocol of the message), click on the Tools menu and select Windows>Details>Details 1. The Details window lists all fields of a structure and includes columns for the name, value, offset (from the beginning of the structure), length, and data type of a field. If a field contains subfields, the field node must be expanded to view the subfields.
Figure 4 shows a Details window for the ROP Output Buffer, which includes parts #3 and #4 (MSOXCROPS module). The RopSize, RopsList, and ServerObjectHandleTable fields compose the ROP Output Buffer (or ROP Input Buffer for requests), as specified in [MS-OXCROPS] section 2.2.1. Figure 5 shows a Details window for part #2 (MSOXCRPC module). The ROP Input/Output Buffer is the payload in the rgbOut field of the EcDoRpcExt2 RPC method, but the value of the Payload field is displayed as raw data instead of the parsed fields that are shown in Figure 4.
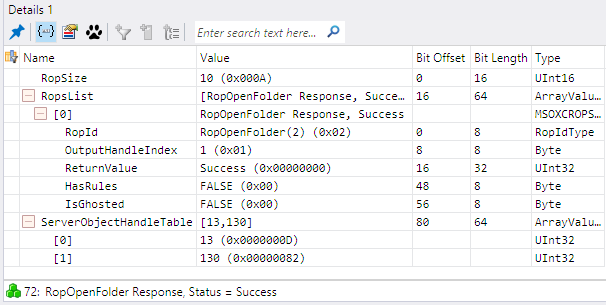
Figure 4: A Details window for the ROP Output Buffer (MSOXCROPS protocol layer)
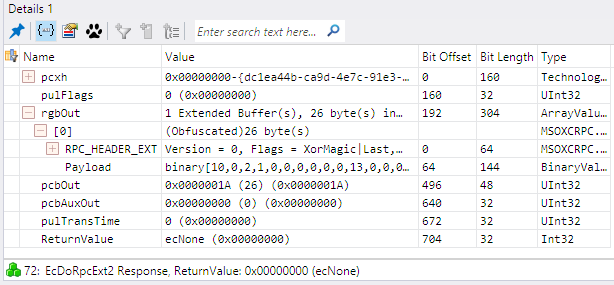
Figure 5: A Details window for the EcDoRpcExt2 method (MSOXCRPC protocol layer)
To view the raw binary data of only the ROPs (part #5), you need to display a Message Data window. Select the RopsList field in the Details window; from the Tools menu, select Windows>Message Data>Message Data 1. The bytes of all ROPs that are contained in the RopsList field will be shaded in the Message Data window. Message Analyzer does not allow you to view the raw binary data for only one ROP in the RopsList field. The Message Data window containing the raw binary data for the RopOpenFolder response is shown in Figure 6. In this case, RopOpenFolder is the only ROP in the RopsList field. Once a Message Data window is displayed, you can view the raw data of any field by selecting the field in the Details window.
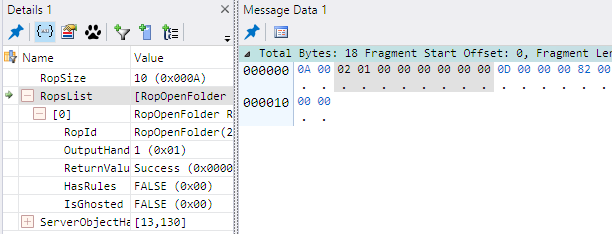
Figure 6: A Message Data window showing the raw binary data of the RopsList field
As previously mentioned in this section, you can also view details by including fields of interest as columns in the Analysis Grid viewer. You can add any field as a column in the Analysis Grid viewer. For example, to add the ServerObjectHandleTable field as a column, right-click on the field in the Details window and select Add Column for 'ServerObjectHandleTable' . Alternatively, you can add fields as columns by using the Field Chooser (from the Tools menu, select Windows>Field Chooser).
Organizing and Isolating Specific RPC/ROP Messages
Message Analyzer enables you to organize and isolate messages in the Analysis Grid viewer by sorting, filtering, and grouping messages. You can organize messages in order according to the values of a particular entity (a field, or any Message Analyzer global property or global annotation) by sorting on the entity column in the Analysis Grid viewer. The Group function of the Analysis Grid viewer enables you to organize messages into groups according to the value of an entity. You can limit the messages that are displayed in the Analysis Grid viewer by filtering according to the value of an entity. This section discusses how these functions are useful for viewing and analyzing Exchange RPC/ROP requests and responses.
Sorting
When you sort on a column of the Analysis Grid viewer, the messages are sorted according to the values of the column. By default, the Analysis Grid viewer sorts the messages by message number in ascending order. To sort on a column, click on the column's heading to sort the values in ascending order. Click on the column's heading a second time to sort the values in descending order.
You can sort according to any entity (a field, or any Message Analyzer global property or global annotation). If the entity is not displayed as a column in the Analysis Grid viewer, it can be added. For details, see the end of the previous section.
Grouping
When you apply the Group command to a particular entity, a group is created for each different value of the entity and the messages are placed into the groups according to the message's value of the entity. You can also create nested groups. Each group displays as an expandable node that is labeled with the value and the number of child nodes. The child nodes of a group are either subgroups or messages. The order in which you apply the group command determines the parent/child group node hierarchy. The top-level group nodes result from the first group created. The lowest-level subgroup nodes result from the last group created. Only the lowest-level group nodes contain the messages.
You may want to group messages according to the session context if your Exchange RPC/ROP traffic contains multiple session contexts. Exchange scopes all messaging objects that are opened by a client to a particular session context. You need to be aware of this when viewing a trace of Exchange traffic—all object-related data, such as handles, unique identifiers, etc., are relevant only for the set of messages that belong to the same session context. Messages for different session contexts may be intermixed, requiring that you pay attention when viewing frames in the RPX output file. This tedious task can be avoided by using the Group function in Message Analyzer.
To group messages according to the session context: Open a Details window for any MSOXCRPC module, right-click on the pcxh.contextUuid field, and select Add Grouping for 'contextUuid' from the menu. You can also apply the Group function by first adding the field as a column in the Analysis Grid viewer and then right-clicking on the column heading and selecting Group from the menu. Note that the pcxh.contextUuid field corresponds to the GUID portion of the session context handle, which is passed by the server in the pcxh field of the EcDoConnectEx RPC response ([MS-OXCRPC] section 3.1.4.1) and is then subsequently used by the client in all EcDoRpcExt2 RPC calls ([MS-OXCRPC] section 3.1.4.2).
The screenshot in Figure 7 shows the results of grouping messages according to session context. Each group node has a label that includes the name of the field to which you applied the Group function, the number of messages in the group, and the value of the field for the group. This particular trace has five groups, but there are actually only three session contexts. The group labeled <Others> contains the EcDoConnectEx requests (one client request to establish each session context), which do not have a value in the pcxh field. The group labeled with zeroes contains the EcDoDisconnect responses (one server response for disconnection of each session context), which always have the pcxh field set to zeroes. The node for session context d1373113-e3f3-47b9-b275-769c06675392 is shown expanded. This group contains 22 messages, but only a few of them are shown to conserve space.
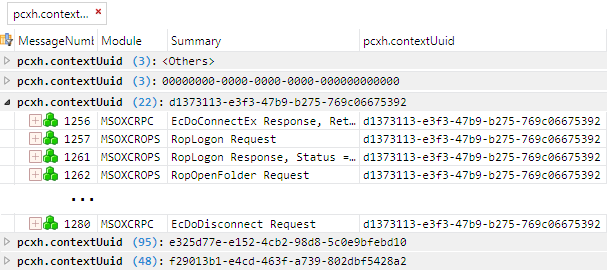
Figure 7: The Analysis Grid viewer with messages grouped according to session context
You may want to filter messages before grouping them. The messages shown in Figure 7 were filtered first, using the filter expression MSOXCRPC (see filter expression #1, listed below in the table of filter expressions), and then grouped according to the session context. If the messages had not been filtered first, the <others> group would contain many more messages, all but three of which would not be Exchange RPC/ROP messages.
If you are interested in viewing only messages for a particular session context, it is better to use filtering instead of grouping. Filter expression #6, which is listed below in the table of filter expressions, filters out all messages except those belonging to the session context that you specify in the filter expression.
Filtering
When you apply a filter, any messages that do not meet the filtering criteria are not displayed in the Analysis Grid viewer. Message Analyzer provides a library of predefined filter expressions. If a predefined filter expression does not meet your needs, you can write your own filter expression, which can be saved in the library. To write a filter expression, open the View Filter window and enter text for the desired expression. Once you've determined your filter expression, apply it by clicking the Apply button in the View Filter window to see the results in the Analysis Grid viewer.
Without a filter applied, the Analysis Grid viewer displays all network traffic with Exchange RPC/ROP messages typically intermixed with other network protocol messages. The screenshot in Figure 8 shows an unfiltered sequence of messages. Note that only three of the nine messages in the sequence are Exchange RPC/ROP messages.
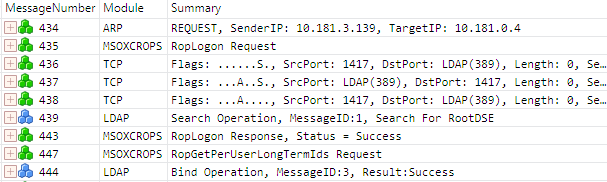
Figure 8: Unfiltered view of a sequence of messages in the Analysis Grid viewer
You can narrow your view in the Analysis Grid viewer so that only Exchange RPC/ROP traffic is displayed by filtering out any message that does not have the MSOXCRPC protocol in its protocol stack. If you right-click on this protocol name in the Module column, the protocol name is added to the text box in the View Filter window as your filter expression. You may need to expand the message node to see the MSOXCRPC protocol in the Module column. (The MSOXCRPC protocol is at the top-level of an Exchange RPC method, as shown in Figure 1, and is at the first child node of an ROP request or response, as shown in Figure 2.)
A combination of filter expressions can further narrow your view to specific Exchange RPC/ROP messages of interest. The following table lists some filter expressions that are useful for isolating Exchange RPC/ROP messages. The numbers in the No. column are for easy reference when discussing these filters.
No. |
Filter Expression |
Result |
|---|---|---|
1 |
MSOXCRPC |
Only Exchange RPC/ROP requests and responses are displayed in the Analysis Grid viewer. |
2 |
*Summary contains "ROP response" |
Only Exchange ROP responses are displayed in the Analysis Grid viewer. (Replace response with request to see only requests.) |
3 |
(MSOXCROPS.RopsList contains "RopX") or (MSOXCROPS.RopsList contains "RopY") or (MSOXCROPS.RopsList contains "RopZ") |
Only ROP requests and responses for the specified ROPs are displayed in the Analysis Grid viewer. Combine one or more expressions, as needed, with the or logical operator and place the actual name of each ROP within the quotes. Example: (MSOXCROPS.RopsList contains "RopOpenFolder") or (MSOXCROPS.RopsList contains "RopOpenMessage") |
4 |
(*Summary contains "RopX") or (*Summary contains "RopY") or (*Summary contains "RopZ") |
Requests and responses for any ROPs that have names beginning with RopX or RopY or RopZ are displayed in the Analysis Grid viewer. Combine one or more expressions, as needed, with the or logical operator and place the desired substring within the quotes. Note that filter #3 returns ROPs having those exact names whereas this filter returns any ROP beginning with these names. Example: (*Summary contains "RopOpen") or (*Summary contains "RopCreate") |
5 |
(M in MSOXCROPS.ServerObjectHandleTable) or (N in MSOXCROPS.ServerObjectHandleTable) |
Only ROP requests and responses that are operating on a server object with the handle M or N are displayed in the Analysis Grid viewer. M and N are the integer values for the handles. Combine one or more expressions, as needed, with the or logical operator. Example: (6 in MSOXCROPS.ServerObjectHandleTable) or (9 in MSOXCROPS.ServerObjectHandleTable) or (13 in MSOXCROPS.ServerObjectHandleTable) |
6 |
MSOXCRPC.pcxh.contextUuid == {UUID} |
Only Exchange RPC/ROP requests and responses for the specified session context are displayed in the Analysis Grid viewer, where UUID is the unique identifier of the session context. Example: MSOXCRPC.pcxh.contextUuid == {e325d77e-e152-4cb2-98d8-5c0e9bfebd10} |
The filter expressions listed in the above table are not predefined in the library — you must manually create them. These expressions use the logical operator or and the relational operators contains and in. The Message Analyzer Filtering Language provides many more operators for use in filter expressions, including bitwise operators, bit shift operators, and arithmetic operators.
Note the difference between filter expression #3 and filter expression #4. Assuming that the specified ROPs are in the trace, the example of expression #3 returns only RopOpenFolder and RopOpenMessage requests and responses; the example of expression #4 returns RopOpenFolder, RopOpenMessage, RopOpenAttachment, RopOpenStream, etc. (A complete list of all ROPs is provided in [MS-OXCROPS] section 2.2.2.) Filter expression #4 works for embedded strings, so you could write the following filter expression to return any requests and responses for any ROP that has "folder" embedded in its name:
MSOXCRPC and (*Summary contains "folder")
This filter expression returns requests and responses for RopOpenFolder, RopCreateFolder, RopGetReceiveFolderTable, RopPublicFolderIsGhosted, RopFastTransferSourceCopyFolder, etc., assuming that these ROPs are in the trace. Note that this filter expression uses the and logical operator to combine filter expressions #1 and #4. Filter expression #1 is included to insure that only Exchange RPC/ROP messages are returned; otherwise, you will get all messages that have "folder" in the summary. You can combine any filter expressions with the logical operators to further narrow your view in the Analysis Grid viewer.
Following a Sequence of Operations
Analysis of Exchange RPC/ROP traffic typically involves examination of a sequence of ROPs that are used to accomplish tasks such as sending an email, adding contents to a folder, copying or moving items between folders, etc. This examination process entails noting the handles of the Server objects and following the sequence of operations in which those handles are inputs. (For details about Server objects, see [MS-OXCROPS] section 1.3.1.) The server assigns a handle to an object when the object is opened or created. The handle is then used as input in subsequent operations on the object. You essentially follow the "trail" of server object handles. This process is tedious in the RPX text file because you have to either scroll through the file, frame by frame, or do a text search for the handles of interest.
To illustrate this process in Message Analyzer, a trace containing operations on folders is analyzed by using some of the features described in the previous three sections of this article. Whether you are doing an analysis in an RPX file or Message Analyzer, a good place to start is by looking at the messages that opened or created objects. In Message Analyzer, I can use the following filter expression to display only requests and responses of ROPs that open or create objects:
MSOXCRPC and ((*Summary contains "logon") or (*Summary contains "create") or (*Summary contains "open"))
The screenshot in Figure 9 shows the ROP messages that are displayed in the Analysis Grid viewer after applying this filter expression. I've added the ServerObjectHandleTable field, which is a field of the ROP Input/Output Buffer, as a column in the Analysis Grid viewer to make it easy to see the handles of the objects that were opened and created.
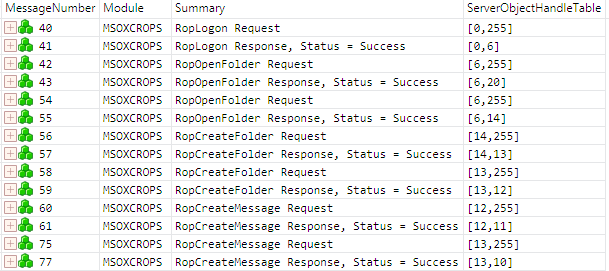
Figure 9: The Analysis Grid viewer with messages filtered to show objects created/opened
From this view, I am able to see the input and output server object handles of the ROP requests and responses. For example, you can see that the server has assigned a server object handle of 6 to the Logon object (see message number 41). The Logon object is then used as the input object in the requests of message numbers 42 and 54. If you need more details about any request or response, you can display a Details window, as explained previously in the section Viewing Details of an RPC/ROP Packet. From examining the details of the RopLogon request, I know that this logon session applies to a public folders store.
By examining the view shown in Figure 9 and using the Details window, I am able to determine the following:
- Frames 40, 41: Logon to a public folder; server assigns the server object handle (SOH) = 6 to the Logon object.
- Frames 42, 43: Open the public folders root (FID = 0001-000000000006) on the Logon object. Server assigns SOH = 20 to the public folders root folder.
- Frames 54, 55: Open an existing folder called "TestPublicFolder" (FID = 0001-000AB50C4E2E) on the Logon object; server assigns SOH = 14 to the "TestPublicFolder" folder.
Note: The RopOpenFolder request specifies only the FID of the existing folder. To determine the display name of the folder, I found the PropertyRow containing this FID in the RowData field of the RopQueryRows, which is not shown in Figure 9 because it has been filtered out. If you need to look at a different set of ROPs to see certain details, you can create another view, as mentioned in the section Getting a Top-level View. - Frames 56, 57: Create a subfolder called "TestFolder1" in the "TestPublicFolder" folder; server assigns SOH = 13 to the "TestFolder1" folder.
- Frames 58, 59: Create a subfolder called "SubFolder3" in the "TestFolder1" folder; server assigns SOH = 12 to the "SubFolder3" folder.
- Frames 60, 61: Create a non-FAI message in the "SubFolder3" folder; server assigns SOH = 11 to this message.
- Frames 75, 77: Create a second non-FAI message in the "TestFolder1" folder; server assigns SOH = 10 to this message.
The result of these operations produce the following object hierarchy, with existing objects specified in black text and new objects specified in red text:
Public folders root (FID=0001-000000000006) — SOH=20
TestPublicFolder (FID=0001-000AB50C4E2E) — SOH=14
TestFolder1 (FID=0001-014E53C09C7D) — SOH=13
message #2 — SOH=10
SubFolder3 (FID=0001-014E53C09C7) — SOH=12
message #1 — SOH=11
Now suppose that you want to view only operations on the "TestFolder1" folder. You can use the following filter expression to filter out all operations except those that have the server object handle 13, which is the handle of the "TestFolder1" folder:
13 in MSOXCROPS.ServerObjectHandleTable
The screenshot in Figure 10 shows the ROP messages that are displayed in the Analysis Grid viewer after applying this filter expression. From this view, you can see that handle 13 is returned by the server in the response of message number 57 for the folder, "TestFolder1", that was created. This handle is then used as input in subsequent ROP requests that operate on this folder.
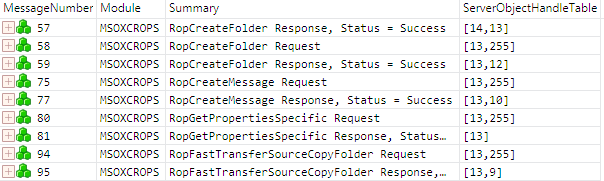
Figure 10: A view with messages filtered to show only operations on a specific object
Note that the trace discussed in this section has single-ROP requests and responses. In other words, each ROP Input/Output Buffer contains a single ROP. When an Input/Output Buffer contains multiple ROPs, the ServerObjectHandleTable field consequently contains more handles. In this case, you may need to look at the details to confirm which handles are inputs and outputs in particular ROPs. This is easily done if you have a Details window displayed.
Identifying and Examining Errors on Messages
Message Analyzer validates the structure, field values, behavior, and architecture of Exchange RPC/ROP messages based on the [MS-OXCRPC] and [MS-OXCROPS] protocol specifications. Therefore, Message Analyzer is an effective tool for testing and verifying your implementation of these protocols.
Any message that produces an error is marked by an icon in the column for DiagnosisTypes, which is displayed as a default column in the Analysis Grid viewer. The following table describes the types of message errors that can occur in Message Analyzer.
Icon |
Diagnosis Type |
Enum Value |
Meaning |
|---|---|---|---|
|
Application |
1 |
The message has an application-related or network communication issue. |
|
Validation |
2 |
The message does not align with its protocol definition. |
|
InsufficientData |
4 |
Message data was lost when Message Analyzer attempted to group messages into an operation or when Message Analyzer performed data reassembly. |
|
Parsing |
8 |
Parsing failed when Message Analyzer attempted to decode invalid message data. |


The DiagnosisTypes is a Message Analyzer global annotation. The screenshot in Figure 11 includes the DiagnosisTypes annotation as a column, which I've indicated with a labeled arrow. Note that the heading of this column is an icon instead of the name DiagnosisTypes. You can view the details of a message error by clicking on the error icon in the DiagnosisTypes column.
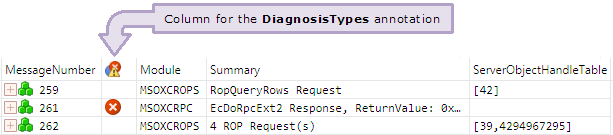
Figure 11: The Analysis Grid viewer with the DiagnosisTypes included as a column
As with any field or Message Analyzer global property/annotation, you can apply sorting, filtering, or grouping. The following filter expression shows how you can use the DiagnosisTypes global annotation to narrow your view in the Analysis Grid viewer so that only messages that have certain errors are displayed. Note that the "#" character must precede the name of the global annotation in a filter expression:
MSOXCRPC and ((#DiagnosisTypes==2) or (#DiagnosisTypes==8))
This filter expression returns only Exchange RPC/ROP messages that have an error of diagnosis type 2 (Validation) or diagnosis type 8 (Parsing). If MSOXCRPC is not included in the filter expression, you will get all messages that have an error of diagnosis type 2 or diagnosis type 8. I've found that Exchange RPC/ROP messages typically have errors of diagnosis types 2, 4, or 8.
The use of sorting, filtering, or grouping to analyze diagnostic messages has some disadvantages. When you sort the DiagnosisTypes column to bubble up diagnostic messages that occurred in a trace, filter to limit the scope to particular diagnosis type, or group messages according to the diagnosis type, you can lose the context of the original surrounding messages that often call attention to where or why certain issues occurred. As an alternative to sorting, filtering, or grouping, you can use the Diagnostics Tool window, which displays all message errors that are present in a trace. This window allows you to view the diagnostic messages independent of the Analysis Grid viewer. To display this window, select Windows>Diagnostics from the Tools menu.