DevHealth60: CE 6.0 PowerToy for memory usage investigation
I don’t like high jacking others blogs, but I am sure Mike won’t blame me for this one, right Mike?
So Mike published this post about a great PowerToy that will definitively help OEMs investigate their memory leaks issues.
In his words…
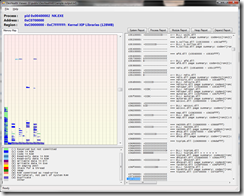
The Windows CE JDP team have just released a PowerToy for CE 6.0 called DevHealth60 – here’s a snip from the DevHealth60 whitepaper – This is a tool that can be used to monitor device memory usage or as the starting point for memory leak and other memory issues investigation. DevHealth60 is a standalone tool to run on Windows Embedded CE6.x devices to take snapshot of virtual memory and output overview of the device memory footprint and detailed memory space layout with page types for all processes. It sums up all the heap pages for each process, as well as the total heap usage for the device. It also gives you a summary for each heap for all processes, including the allocation size, the number of blocks, and the starting and ending addresses.
The DevHealth60 PowerToy can be found on MSDN Code Gallery
Here’s a screenshot of the DevHealth60 viewer application.
Note that this is a PowerToy, so there’s no official support for the tool, the authors will look out for comments/questions on the project homepage on MSDN Code Gallery.
- Mike
