Attach debugger across different logon sessions
Attaching a debugger to a service/application in a different logon session might be a little tricky. Every time a successful authentication occurs on the machine, a new logon session is created. So, when you log on interactively => the system creates a new logon session. When you connect to a machine remotely and authenticate => a new logon session on the target machine is created.
Here is my scenario: I was using terminal services to connect to a Win2K machine – and of course a new session was created for me (unlike later Windows versions, Windows 2000 doesn’t allow you to connect the session logged on at the console of a server, like you can do with mstsc /console in Windows Server 2003 or with mtsc /admin in Longhorn Server). Of course I didn’t pay much attention to this, but I ran into a problem when I tried to attach the debugger to the ASP.NET worker process (aspnet_wp.exe in this case, Windows 2000 comes with IIS5).
Basically, from a command prompt I ran cdb -pn aspnet_wp.exe and I got the following error:
Cannot debug pid 1444, Win32 error 5
"Access is denied."
First thought: I don’t have rights to debug. To be able to debug, we need the SeDebugPrivilege. The groups Administrators and “Debugger Users” have this privilege. To check if you have the debug privilege, you can use whoami /all or you can get fancy and use a debugger – from a command prompt, run cdb -c "!token -n; q" notepad. This command:
- Opens notepad under debugger,
- Then in debugger executes the commands:
o !token –n – which displays a formatted view of a security token object
o And q – quit the debugger.
This only works for Windows XP and later. It will show a lot of output, finishing with the privileges:
00 0x000000017 SeChangeNotifyPrivilege Attributes - Enabled Default
01 0x000000008 SeSecurityPrivilege Attributes -
02 0x000000011 SeBackupPrivilege Attributes -
03 0x000000012 SeRestorePrivilege Attributes -
04 0x00000000c SeSystemtimePrivilege Attributes -
05 0x000000013 SeShutdownPrivilege Attributes -
06 0x000000018 SeRemoteShutdownPrivilege Attributes -
07 0x000000009 SeTakeOwnershipPrivilege Attributes -
08 0x000000014 SeDebugPrivilege Attributes - Enabled
09 0x000000016 SeSystemEnvironmentPrivilege Attributes -
A simpler way is to check that you belong to Administrators or “Debugger Users” on the machine you are trying to debug. If you don’t, add your user account into “Debugger users” group:
- Run Computer management as Administrator (or log in as Administrator and open Administrative Tools -> Computer Management)
- Choose “Local users and groups” -> “Groups” node
- Double-click “Debugger users” group on right pane to open the Properties dialog box.
- Click the “Add” button, type your user account and click “Ok”.
After being added to the “Debugger Users” group, you must log off and log back on for the setting to apply.
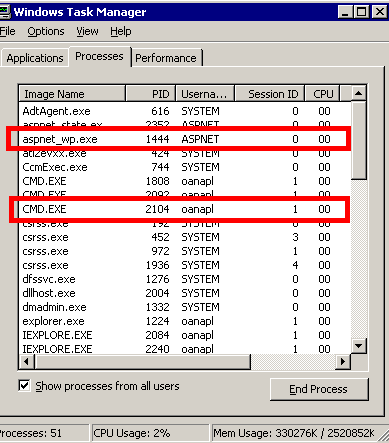
In my case, I was Admin on the Win2K machine, so I had all the privileges I needed. Then why access denied? Opening Process Explorer (from Sysinternals tools), I see that the worker process is running in session 0, but I am in session 1. You can also see this in task manager (if SessionID column is not selected, go to View -> Select Columns and check the checkbox for it):

So I need to attach the debugger in session 0, create a remote and attach another debugger in session 1 to the first debugger session. To open a process in a different session, I use psexec from Sysinternals tools. Here are the steps:
1. Get the worker process (aspnet_wp.exe) process id – 1444, see above in task manager. You could also use tlist from Debugging tools for Windows package (tlist | findstr aspnet_wp).
2. To start a process in session 0: psexec –i 0
To attach the debugger and create a remote: <debuggerName> -server npipe:pipe=aspnet_wp1444 -g -p 1444
<debuggerName> can be replaced with your favorite debugger – cdb, windbg, whatever. This command attaches the debugger to process with id 1444 ( -p 1444), ignoring the initial breakpoint ( -g) and creates a remote ( -server npipe:pipe=aspnet_wp1444). So, assuming I’m using cdb as a debugger, the command looks like:
psexec –i 0 cdb -server npipe:pipe=aspnet_wp1444 -g -p 1444
3. Then connect to the remote debugger in session 1:
<debuggerName> -remote npipe:server=<computerName>,pipe=aspnet_wp1444
For example, if computer name is OANAPL_Win2K and I use windbg:
Windbg -remote npipe:server= OANAPL_Win2K,pipe=aspnet_wp1444
I usually use cdb for the first debugger and WinDbg for the second – where I will actually type commands (I like the UI, it’s really helpful especially if you use debugger extensions that have output commands formatted with DML).
And that’s it: now I can debug the worker process running in session 0 with a debugger attached in session 1.