Row Level Security - Demystified
In this article, I will use the following features: Parent Child Relationships, Row Level Security in Analysis Services (AS) 2012 Tabular Mode, and the Analyze in Excel feature in SQL Server Data Tools (SSDT). This article will also use various DAX functions to accomplish these goals.
In the book “Professional Microsoft SQL Server Analysis Services 2008 with MDX” (Siva Harinath, March 2009, Wrox Press ) , there is a chapter on security in a multi-dimensional database. This chapter is based on a survey conducted by the director of a company that would like to understand the satisfaction level of their employees. This survey requires that managers are only allowed to see feedback if at least four employees reporting up to them have responded. If less than four respond, a manager is unable to see any results. This is designed to protect the identity of those responding to the survey, so that a manager is not able to guess who gave a negative score.
While Siva’s book focuses on solving the survey problem based on a multi-dimensional AS database, in this article, I am going to reproduce the same solution in an AS model in Tabular mode. The design of the security model in Tabular mode is different enough that we cannot simply follow Siva’s example to create the security model. We must use Row-level security, which is how data access can be restricted in tabular models. Furthermore, the survey featured in this article is based on a satisfaction poll, but uses different questions. I am using the results of a survey conducted here in the AS team to rate various potential moral events from “Great” to “Bad”, with four possible choices. In the example given in the book, there are five possible responses, but for my example four is sufficient. You can find my sample data with obfuscated personally identifiable information in a PowerPivot workbook attached to this article. You can open the workbook first in PowerPivot to View it there, like we will proceed to do, or directly import it into SSDT. The following figure shows the PowerPivot tables and relationships.
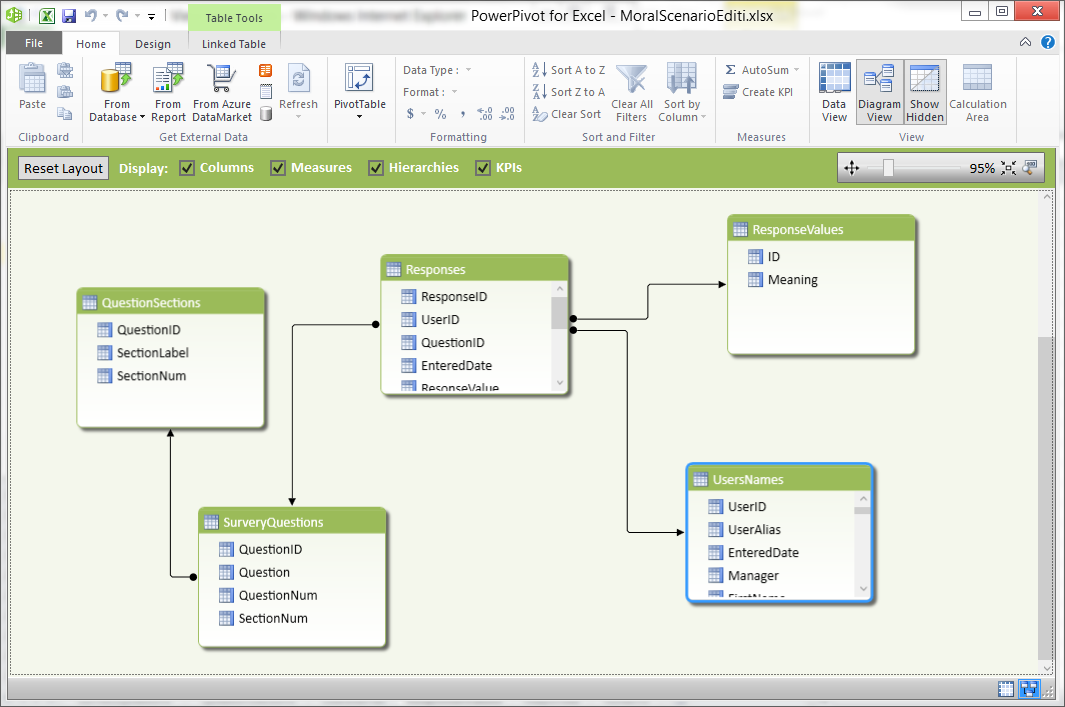
First, let’s look at what is contained in this workbook, to clarify the structure that I will use later to create the security design. The data is laid out in five tables. The first table, SurveyQuestions, contains a list of questions with an ID to link it to the other tables. QuestionSections contains the different sections used to categorize the questions. The UserNames table contains the users that took this survey. It also has the manager listed for each employee, which enables us to create a tree to find out how many employees report to a given manager. The ResponseValues table gives the four valid responses. Finally, Responses is the fact table listing each response by every employee on every question. The tables have relationships created between them to assist in modeling the data. This will allow us to look at question names instead of questions by their ID.
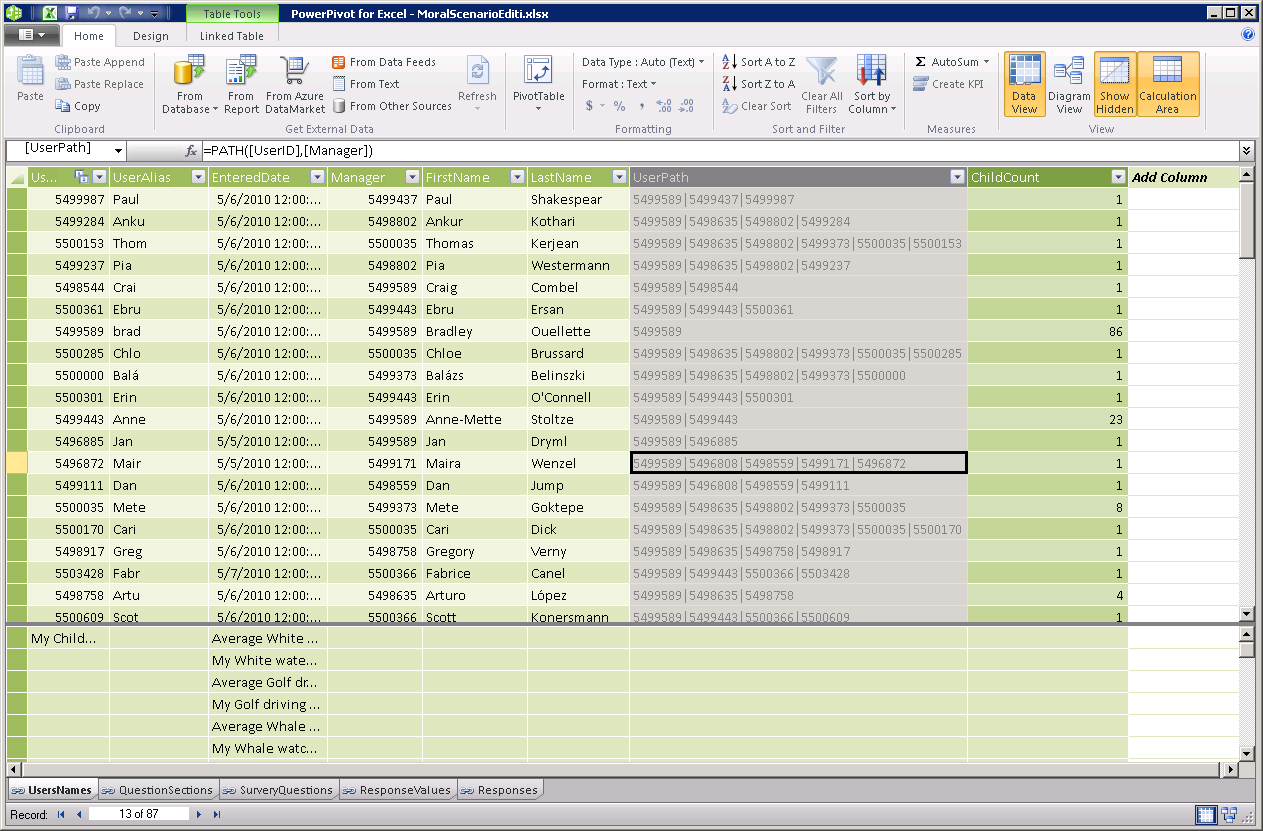
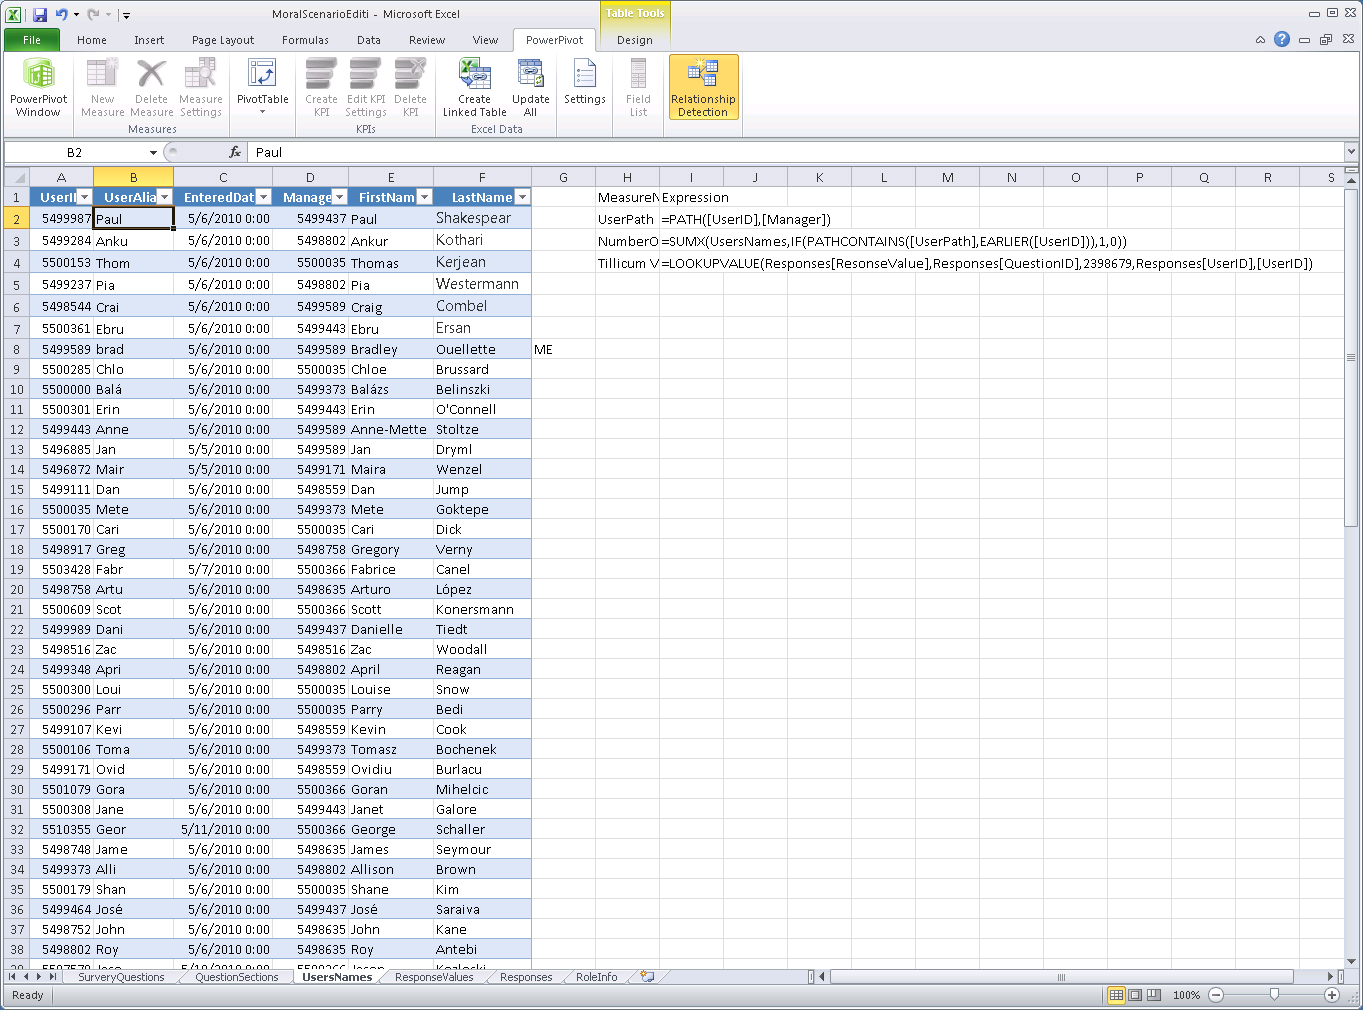
Now that we have covered the basic structure of the data, let’s go over the measures and calculated columns in this sample workbook. As seen in the following screenshot, the UserNames table has two columns and multiple measures.
These calculated columns and measures are defined using the Data Analysis Expressions (DAX) language in PowerPivot. DAX populates the rows of a column, or the result of a measure. Even though both calculated columns and measures rely on DAX formulas, there is one major difference between these two that is relevant to security. Calculated columns are populated when the database is processed or refreshed. Measures on the other hand are not stored, meaning they are calculated at query time. This is important to keep in mind because it implies that database security is applied to the rows of a calculated column after the column is filled in, as opposed to a measure that will apply the security first, and then only use the data the user is allowed to access when calculating the results.
For our sample, we need to use DAX to calculate average results for all employees that report up to a specified manager. First, we require a DAX expression to determine the direct reports per manager. This expression can then be used in other functions to calculate averages based on the number employees per manager. It can also be used to aggregate rows for a given manager.
DAX has functions for working with Parent Child relationships, such as to establish a relationship between direct reports and their managers. They all use the path from the employee referenced in the current row, up to the top of the Parent Child tree. For example, the PATH function expects an ID column and the column containing the current row’s parent, “ =PATH([UserID],[Manager])”. The PATH function then produces a string for each row with a list of parents up to the top of its tree.
Since the path is not going to be useful for analyzing data, we will hide any calculated columns that are based on the PATH function. Keep in mind, however, hiding a column will not protect the data. The data is still available, but it won’t show up in Excel or other modeling tools. It can still be used in measures defined now or later when a user is viewing the data. For example, I created a ChildCount calculated column to determine the number of employees reporting to a given manager:
“ChildCount” “=COUNTROWS(FILTER(ALL(UsersNames), PATHCONTAINS([UserPath],EARLIER([UserID]))))”
This formula counts the rows with the current employee in the path. It is important to note the employee itself is the first node, so the result is off by one from what we would expect, since an employee usually does not report to him/herself.
Now, let’s move from calculated columns to measures. As I stated above, the UserNames table contains many measures. They only vary on the QuestionID. So, I’ll go over one of the measures next and invite you to explore the rest on your own. The remaining measures are just variations.
Average White Water Rafting Results:=if(HASONEVALUE(UsersNames[UserAlias]),LOOKUPVALUE(Responses[AverageChildResponce],UsersNames[UserAlias],Values(UsersNames[UserAlias]),Responses[QuestionID],2398673),BLANK())
The Average White Water Rafting Results measure looks up a specific value that is calculated on the Responses table, which I will cover next. The measure is added to a PivotTable to display the data in Excel. Because we must protect the individual results from employees that have taken this survey, we cannot just calculate averages in the measures. At the time the measures are evaluated, the measures will not be allowed to see the data for each individual employee, only the responses for the current employee. Calculated columns, on the other hand, are evaluated at processing time so they work with all the data in the model.
The Responses table has calculated columns to lookup the average response for all employees that report up to a particular manager. The AverageChildResponse column and others used to create it can be seen in the following screenshot.
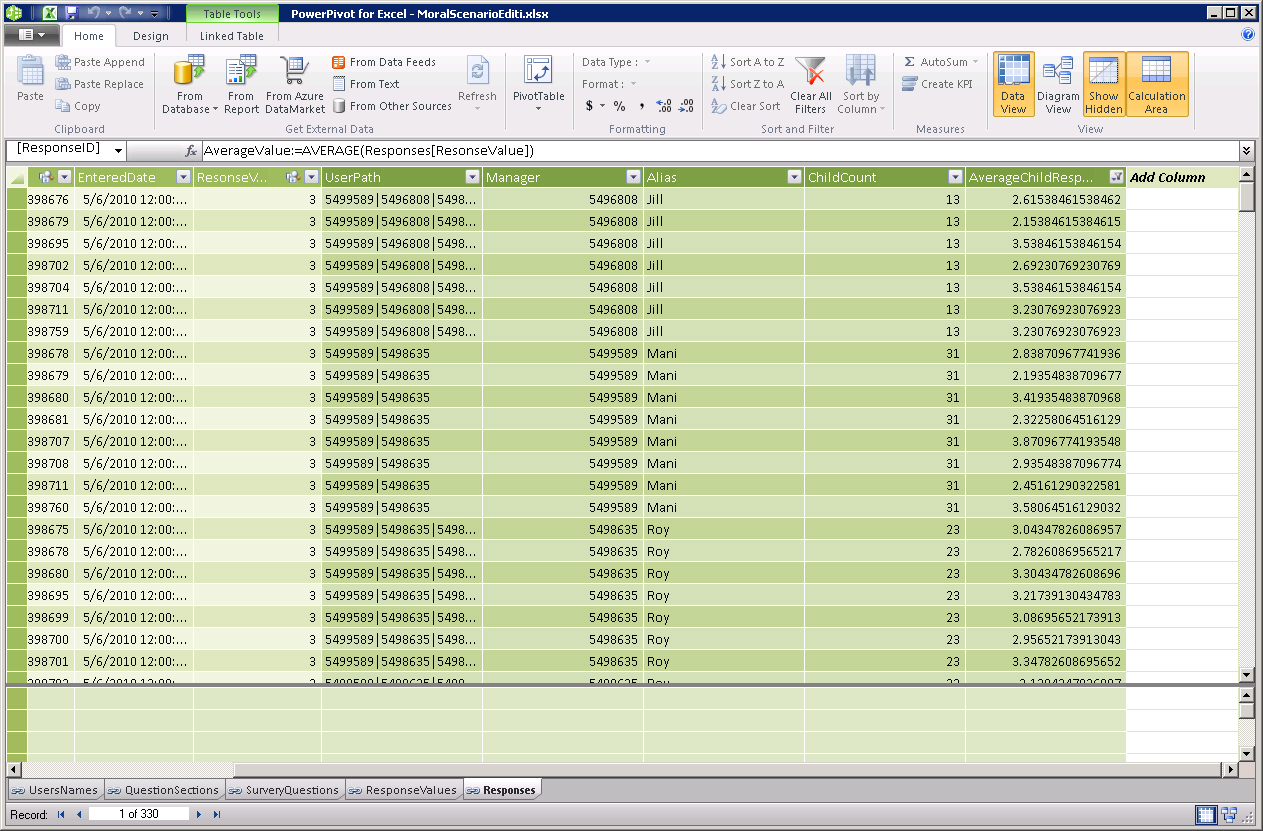
The Responses table includes multiple calculated columns that contribute to the end result, but it could also be calculated in one statement. For simplicity of the formulas, and to make it easier to see what is going on, I broke the logic out into multiple calculated columns. If you wanted to implement this example with your own data, you may want to remove these extra columns because they consume space in the model.
The AverageChildResponse column first calculates the result without worrying if individual responses are being exposed. Because it performs the calculation before applying the security context, we get the average of the responses. In the next step, the DAX formula eliminates average values if there are less than five users that contain the current user’s ID in their path. To offset the fact that child count includes ourselves we actually set the expression to five instead of four.
=if([ChildCount]<5,BLANK(),CALCULATE([AverageValue],
ALL(UsersNames),
FILTER(ALL(UsersNames), PATHCONTAINS([UserPath],EARLIER([UserID]))),
ALLEXCEPT(Responses,Responses[QuestionID])
))
Before moving on, you may want to make some modifications to the provided workbook. The data in the model is using names copied out of the AdventureWorks database; as such you probably will not have any real user accounts with these names. This step is optional though, since the example will work without real user names. It is easier to test the database if there is a real account in there now.
To add your own user name to the data, open the workbook in Excel. Navigate to the Excel UserNames table, and then change one of the UserAlias values to your own user account. For example, mine is Brad. Keep in mind that if you change one with less than four direct reports, you will see no data in Excel. Having added your user name, just update the PowerPivot model by opening the PowerPivot window, or by selecting Update All on the PowerPivot tab.
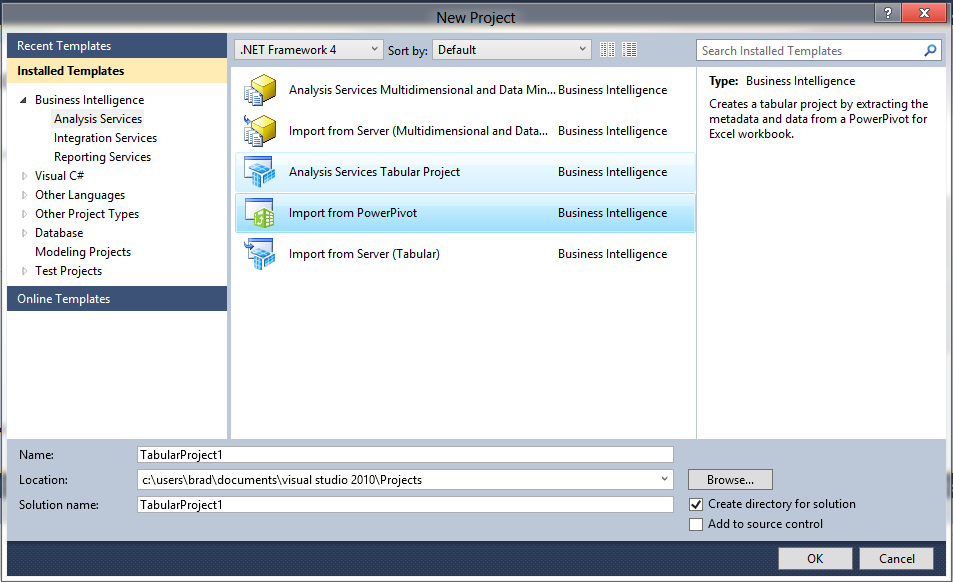
Now that we have covered the important elements in the sample workbook, we will apply a security role. PowerPivot is designed for a single user and does not support role-based security, but you can migrate your workbook to a tabular database by using SSDT in Visual Studio. In Visual Studio select New Project, and then under Business Intelligence Templates, there is an option to Import from PowerPivot.
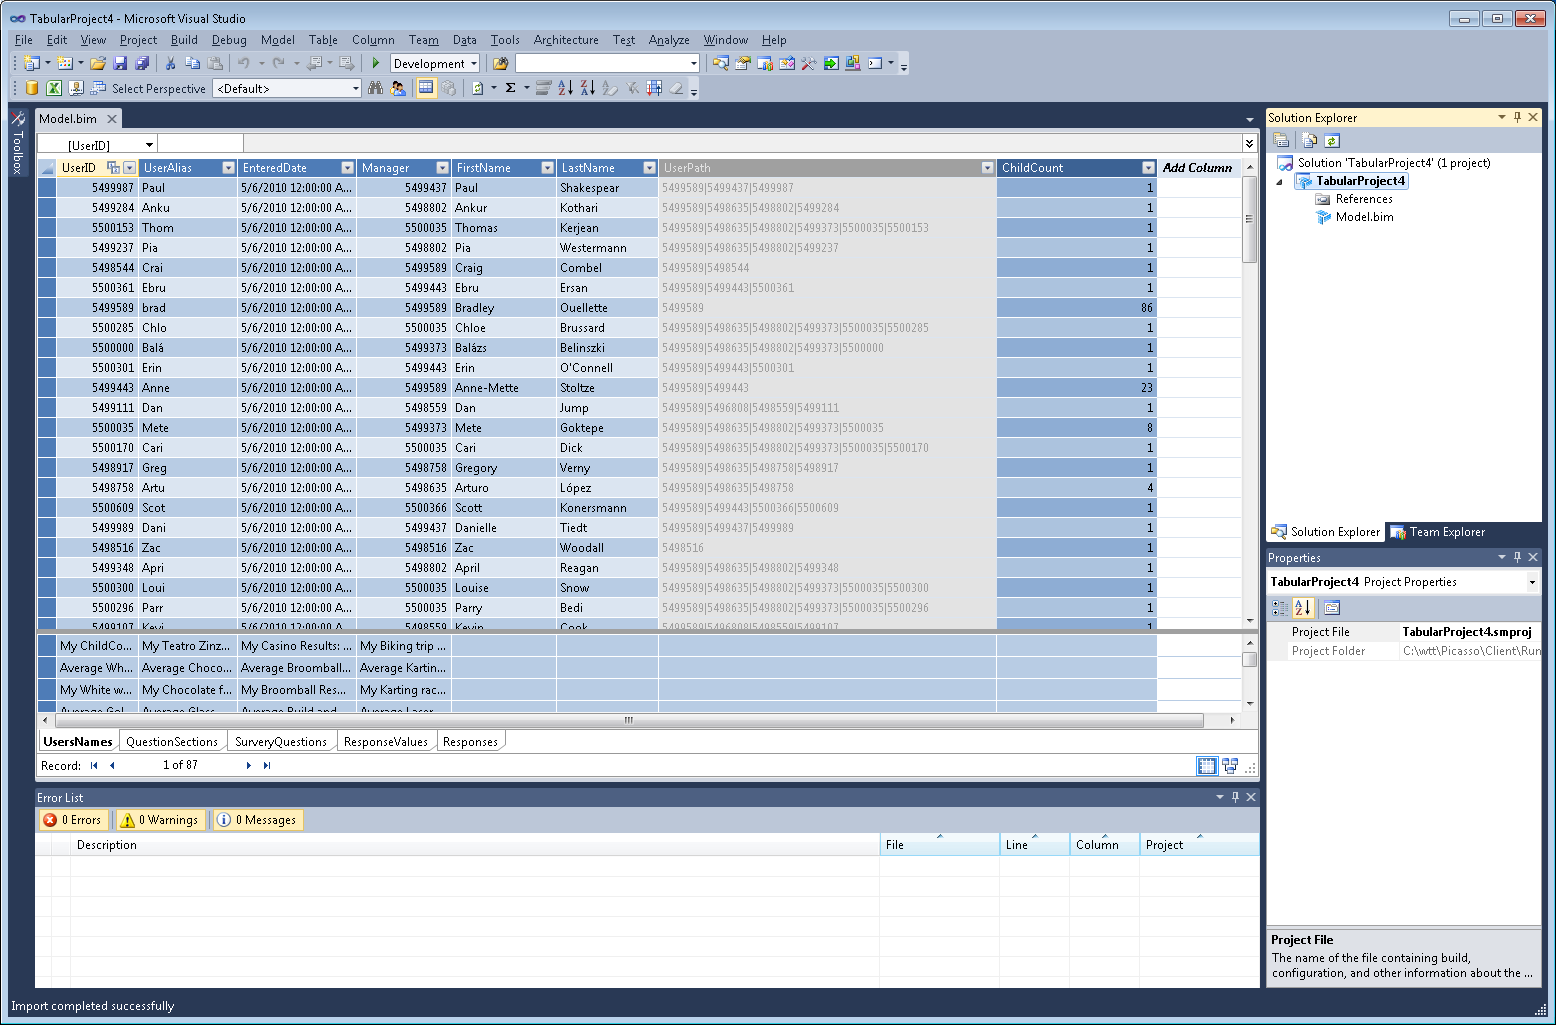
Visual Studio displays a File Dialog, which, after selecting the workbook, will give you a new tabular project with the PowerPivot data already in it.
In this new Tabular Project, you can now create the desired security role. You can launch the Role Manager on the Model menu to create this role. Click on the Roles menu item.
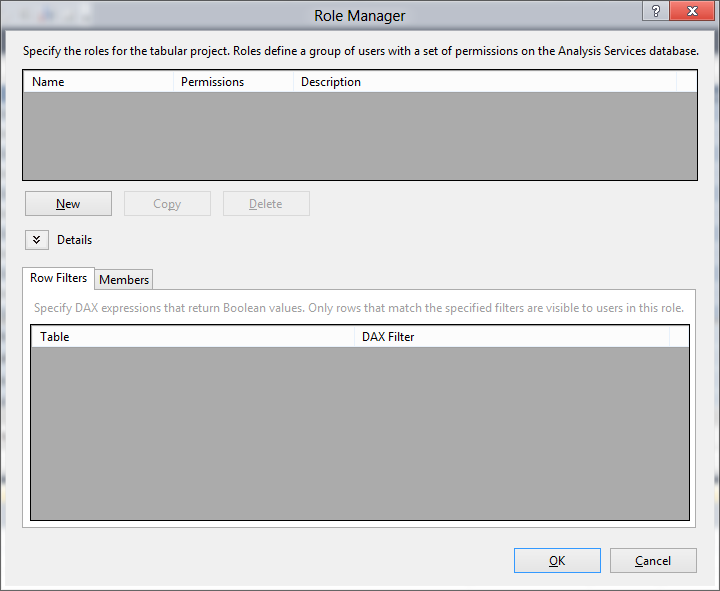
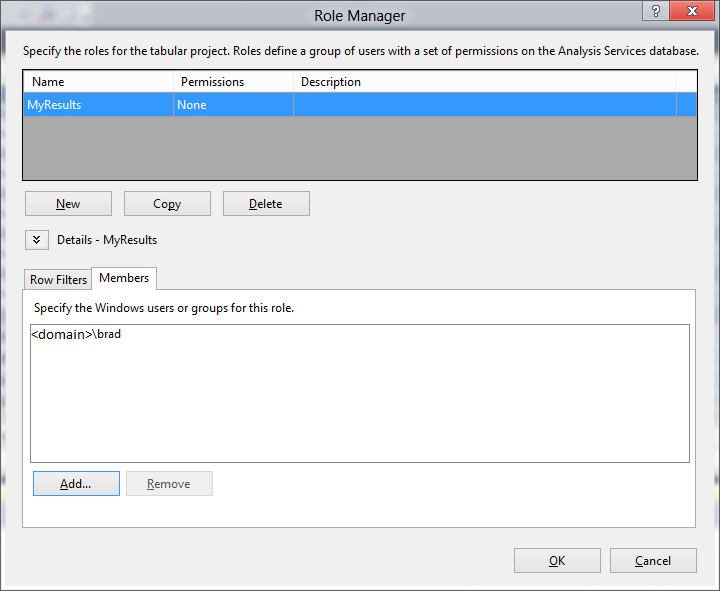
In Role Manager, create a new Role to block the user from seeing results for other users. This is accomplished by clicking the New button. Define a filter on the UserNames table that is equal to “=LOWER([UserAlias])=SUBSTITUTE(LOWER(USERNAME()),"<domain>\","")”. The DAX formula uses a <domain> placeholder. Make sure you replace this with the name of your local domain. If you have no domain, simply change the formula to “=LOWER([UserAlias])= LOWER(USERNAME())” removing the domain completely. Once the form is filled out, it should look as displayed in the following screenshot.
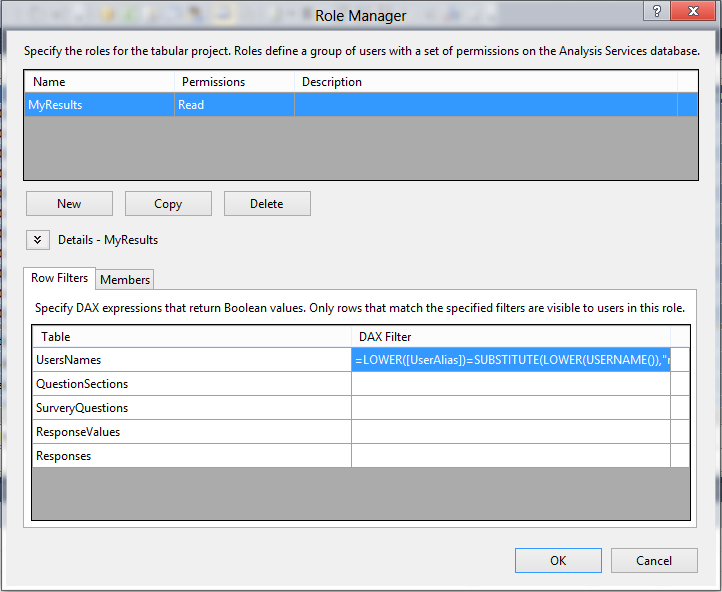
Don’t forget to select Read as the type of permissions. This will enable the role to query the database, but not change the model.
The effect of this role is that all rows in the UserNames table are filtered so that users can only see rows that contain their user name. One other interesting aspect of roles in Analysis Services is they passively follow relationships. This means the user is also unable to see rows in the Responses table that do not correspond to their row in the UserNames table. This is why it was important to find the average values in the calculated column. Calculated columns are evaluated at the time the database is processed and therefore see all the data. Conversely, measures are evaluated at the time of the query, and as such will only see data the user is currently allowed to access.
Now that we have a role, we must apply it to the users. To do that, switch to the Members tab. On this tab you can add users that will be able to read the database, but only their rows. If a user isn’t a member of any roles, that user will not even be able to connect to the database.
To test this new role in Visual Studio, select the Model menu, and then select Analyze in Excel.
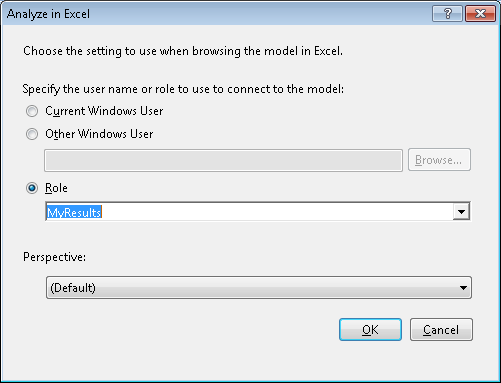
The Analyze in Excel feature gives you multiple options: You can connect as the current Windows user, a different Windows user, a specific role, or with a perspective selected. The Perspective option is not interesting for our scenario. The Current Windows User option uses your logged on credentials. Since the model is always created with the current user having admin privileges, connecting with this account will not apply any security to the model. This is more useful if you wanted to see all the data. If you did not set your user account in the model, setting the specific role will not be useful since your user account will not have any data to view, similar to a user that has less than four direct reports. On the other hand, if you added your own account to the model, you can easily select the role that you just created and it will be applied to your current user account.
The Other Windows User option enables you to select a specific user account. This option applies whatever roles list this account on their Members tab, so you need to have the user assigned to a role to use this option. This option also has another limitation, that like the role manager’s Members tab, it uses Windows user accounts, so the account has to exist to be able to reference it.
When selecting Analyze in Excel, you open an empty Excel workbook. In order to display results for the current user, add the User Alias column to the row Labels, and a measure for the average of the question you care about, as the following screenshot demonstrates.
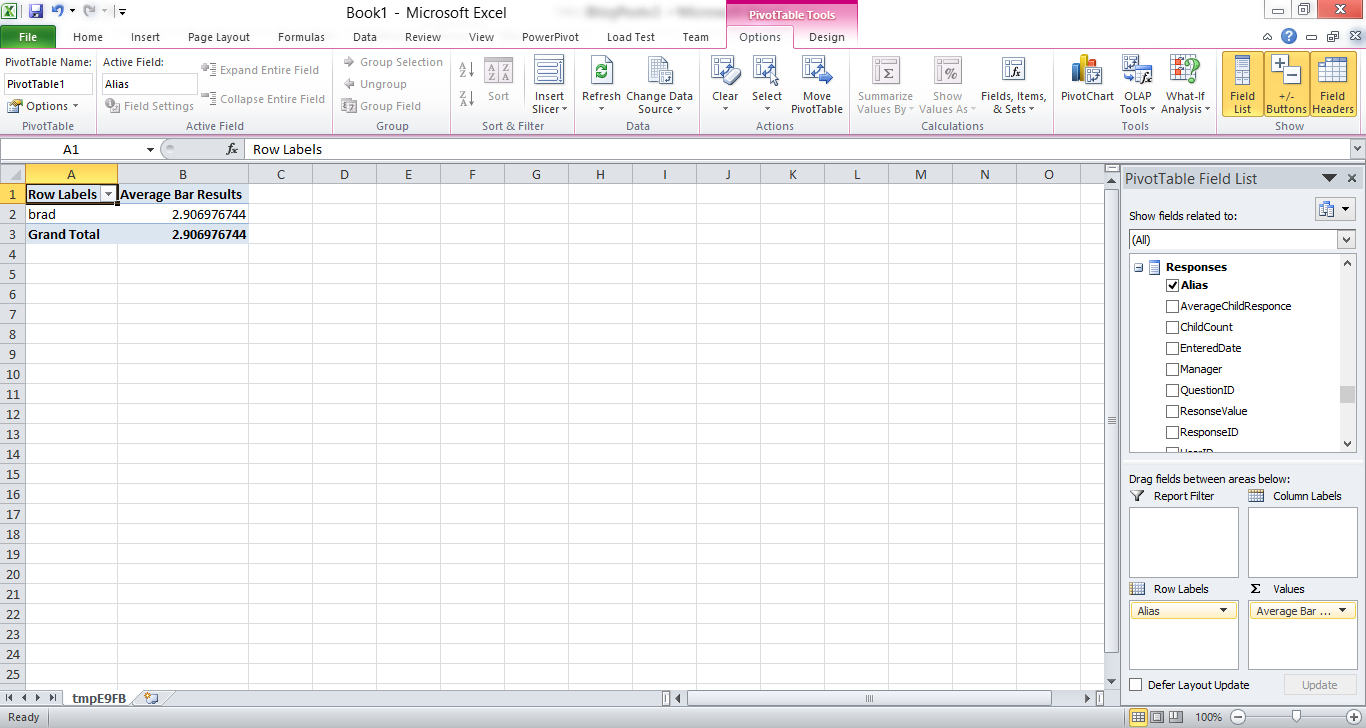
Finally, you can connect with other accounts to see the results of their reports. You can also deploy your project to a production server, and then just share the connection information. Anyone with responses from more than four reports would be able to connect and see the own results without exposing the individual survey takers.