Disk Performance Internals
Abstract:
My name is Ran Jiang. I am from the Platforms Global Escalation Services team in China. Storage is the slowest component of most computer systems. As such, storage is often a performance bottleneck. Today I want to discuss the disk performance kernel provider, partition manager. By understanding how the disk performance provider works we can understand how disk performance is tracked internally in Windows and how disk related counters are calculated, which will be helpful for diagnosing storage performance issues.
Disk Performance Architecture
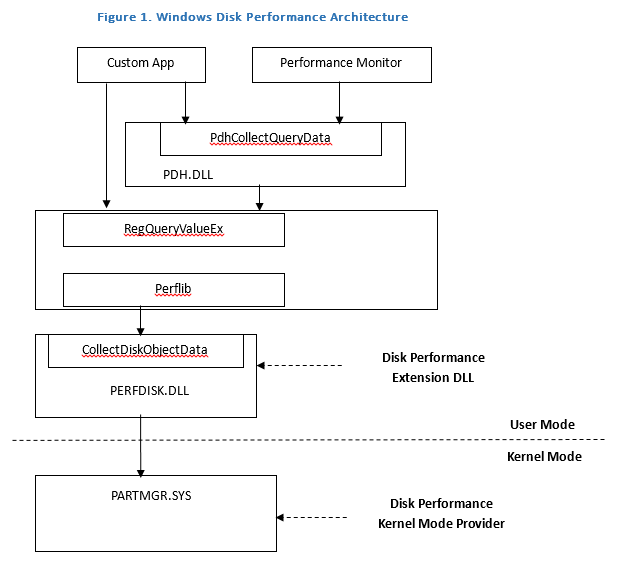
There are two sets of public interfaces to query performance counter data – PDH (Performance Data Helper) or the registry interface. The registry interface to the performance data is older than the PDH interface and has more extensive functionality. However, the PDH interface is easier to use for most performance data collection tasks. The PDH interface is essentially a higher-level abstraction of the functionality that the registry interface provides.

Windows performance monitor leverages the PDH interface to get performance data. The performance data helper (PDH) interface calls the registry interface.
Perflib is one key component integrated in the registry interface, which is responsible for translating the request from the application and calling the collect procedure exported by a performance extension DLL. The extension DLL does the real work of data collection and returns a standard data format to perflib.
Extension DLLs should expose Open, Collect, and Close functions to be called by perflib. We can find these functions’ name by checking the registry:
HKEY_LOCAL_MACHINE\SYSTEM\CurrentControlSet\Services\<Service Name>\Performance
Value Name: Close, Collect, Open

Here is a user mode call stack when an application uses the registry API RegQueryValueEx() to collect performance data:
0017f7ec 004e0000 perfdisk!CollectDiskObjectData+0xf8
0017f964 7702eaa9 advapi32!QueryExtensibleData+0x577
0017fd48 7702e962 advapi32!PerfRegQueryValue+0x5d8
0017fe38 770576f5 advapi32!LocalBaseRegQueryValue+0x313
0017fe9c 004011fc advapi32!RegQueryValueExW+0xa2
0017fec8 00401153 getperfdata!GetPerformanceData+0x3c
0017ff38 0040322a getperfdata!wmain+0x93
0017ff88 773deccb getperfdata!__tmainCRTStartup+0x15e
0017ff94 7798d24d kernel32!BaseThreadInitThunk+0xe
0017ffd4 7798d45f ntdll!__RtlUserThreadStart+0x23
0017ffec 00000000 ntdll!_RtlUserThreadStart+0x1b
Disk performance kernel device stack
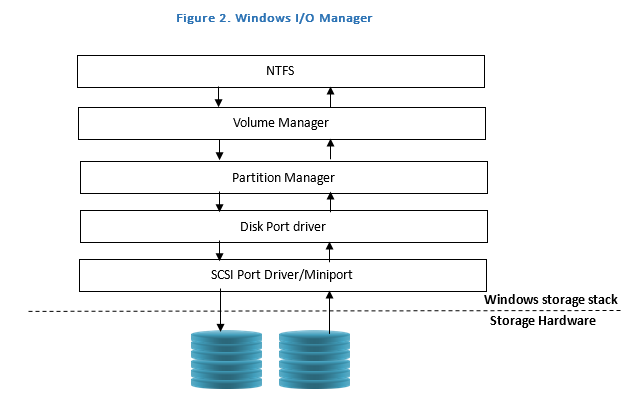
Figure 2 shows the I/O manager stack to gather disk performance statistics. The volume manager underneath the file system driver gathers Logical Disk statistics. On Windows 2008 or above, volmgr.sys handles Logical Disk statistics for both dynamic and basic disks. The partition manager, partmgr.sys, gathers physical disk statistics. These statistics are measured and collected for each request that passes through the I/O manager stack.

Physical Disk Statistics
Partition manager (partmgr.sys) saves performance information in the device extension’s counter context.
Logical Disk statistics
Volume manager (volmgr.sys) also saves performance metrics in its device extension.
How to track disk performance?
Performance information is tracked in the read and write dispatch routines and in the IO completion routines. There are 5 kinds of counter data tracked by partition manager:
1. Queue depth - Total concurrent IOs still in process and not yet completed.
2. Total counts of read and write requests.
3. Total read and write time for all IO requests. For example: There are total 2 write IOs completed since disk counter is enabled, one takes 1 sec and the other takes 2 sec. Then, this write counter will be 1 sec + 2 sec = 3 sec.
4. Total Idle time.
5. Total split IO (fragmented IO).
Let’s talk about them separately.
Queue depth:
When a new IRP is sent to partition manager it will increment the queue depth. Partition manager will decrement the queue depth when completing an IRP. Therefore, the value indicates how many concurrent IOs are still in process.
Total read and write count:
When any read or write IO has been completed the partition manager IRP completion routine will get called. Then the read or write counter will be incremented. Note we only track completed IOs here.
Total read and write time for IOs:
When any read or write IO starts, partition manager’s dispatch routine will record the current time stamp in the IO stack location of the IRP. When an IRP is completed the completion routine will use this time stamp and the current system time to calculate the time taken to complete this IO. Partition manager will then add this value to the appropriate counter in the device extension.
Total Idle time:
When completing an IRP and decrementing the queue depth partition manager will check if the queue depth reaches 0. If yes, it indicates the disk state has been transitioned from busy to idle. Then it will save the time stamp to Last Idle Clock in the counter context.
When a new IRP is sent to partition manager it will increment the queue depth and will check if queue depth reaches 1. If yes, it indicates the disk state has been transitioned from idle to busy. Then Idle time counter will be increased by (current time stamp – Last Idle Clock).
Total split IO (fragmented IO):
When completing an IRP, partition manager will check if the IRP is marked as IRP_ASSOCIATED_IRP. This flag is usually set by the file system driver when a large IO is split into multiple smaller IOs. Typically, when an IO contains several runs and each run will contain continuous block of data, NTFS will create an associated IRP for each run and send this IRP to the lower level driver. Therefore, this counter usually can be used to track fragmented IOs.
Note: Disk performance statistics are saved to an array whose index corresponds to each processor. Most of the counters are saved to the index corresponding to the processor the IRP was completed on.
How to convert to performance counter?
Now we understand how the kernel keeps tracking of these metrics. We need to map those metrics in kernel to the performance counter as shown in performance monitor. The counters visible in performance monitor are calculated based on the metrics from kernel. Each counter has a counter type and each counter type has a different calculation. The counter type determines how the counter data is calculated, averaged, and displayed.
For example, Avg. Disk sec/Transfer has counter type of PERF_AVERAGE_TIMER. The formula of PERF_AVERAGE_TIMER is: ((N1 - N0) / F) / (D1 - D0), where the numerator (N) represents the number of ticks counted during the last sample interval, F represents the frequency of the ticks, and the denominator (D) represents the number of reads and writes completed during the last sample interval. N1 - N0 are returned from kernel as ReadTime + WriteTime in ticks. D1 and D0 are returned from partition manager or volume manager as read counts + write counts.
Avg. Disk Transfer/sec:
Counter type: PERF_COUNTER_COUNTER
Formula: (N1- N0) / ( (D1-D0) / F), where N1- N0 are returned from partition manager or volume manager as read counts + write counts. D1-D0 are the number of ticks counted during the last sample interval. F represents the frequency of the ticks.
Avg. Disk Queue Length:
Counter type: PERF_COUNTER_LARGE_QUEUELEN_TYPE
Formula: (N1 - N0) / (D1 - D0), where the numerator (N) represents queue depth and the denominator (D) represents the time elapsed during the sample interval.
Current Disk Queue Length:
Counter type: PERF_COUNTER_RAWCOUNT
Formula: None. Shows raw data as collected. It’s Instantaneous value of queue depth.
Disk Bytes/sec:
Counter type: PERF_COUNTER_BULK_COUNT
Formula: (N1 - N0) / ( (D1 - D0) / F, where the numerator (N) represents the total ReadBytes + WriteBytes, the denominator (D) represents the number of ticks elapsed during the last sample interval, and F is the frequency of the ticks.
% Idle Time
Counter type: PERF_PRECISION_100NS_TIMER
Formula: NX – N0 / D1 – D0, where the numerator (N) represents the Total IdleTime and the denominator (D) is the value of the private timer. The private timer has the same frequency as the 100 ns timer.
Note: Programmers should avoid calculating counters manually and should instead use pdh.dll. An example of what can go wrong when calculating this data manually is described in Performance Monitor Averages, the Right Way and the Wrong Way.
How to measure disk performance?
In this section we are going to discuss which counters are the key to measuring disk performance. Generally we have 4 counters used for performance measurement: Disk Bytes/sec, % Idle Time, Disk sec/Transfer and Avg. Disk Queue Length.
Disk Bytes/sec
From the formula, Disk Bytes/sec is actually how many bytes have been completed in every second. There are two things could impact this counter value:
1. How much stress is generated to the disk or volume?
Let’s assume if there are no problems with disk performance and stress has not reached the storage bottleneck. Then, this counter value will be determined the stress IO load generated by the application such as a stress tool.
2. Disk performance
If the IO load has exceeded the storage bottleneck, this counter value will not be able to be increased with load increasing.
Conclusion: Since this counter value could be affected by IO load from an application we cannot use it as the key to determine disk performance.
% Idle Time
This counter value indicates how long the disk is in idle status without outstanding IO. It can help to determine how busy the disk is. However, even if the disk is busy with 0% Idle Time, we cannot say it suffers from a performance issue as it may still be able to complete all IOs in time.
Avg. Disk Queue Length
This counter indicates on average how many IOs are outstanding. If the disk can always complete IO immediately, the value should be 0. Therefore, it’s also a value to determine how busy the storage is. But it does not impact the application directly as the application does not care how many total IOs are outstanding. The application is concerned with how fast every IO can be completed. In practice, if we see the queue depth is more than 10 we may say the storage is busy and could delay the IO in the queue. However if every IO can be completed fast there will be no impact to the application, which means the delay is still acceptable.
Disk sec/Transfer
This counter indicates how fast the IO is completed on average. This is one of the keys to an application’s performance as discussed above.
Dynamic counter loading feature
On Windows 2008 or above the disk counter in the kernel provider can be dynamically enabled or disabled. If there is no one open handle to HKEY_PERFORMANCE_DATA the kernel provider will disable IO performance trace by setting a flag in the device extension. Here is the Call stack when the counter is being dynamically disabled:
8f14d970 volmgr!VmWmiFunctionControl
8f14d9e0 WMILIB!WmiSystemControl+0x3b9
8f14da00 volmgr!VmWmi+0x8d
8f14da18 nt!IofCallDriver+0x63
8f14da20 volsnap!VolSnapDefaultDispatch+0x2b
8f14da38 nt!IofCallDriver+0x63
8f14da60 nt!WmipForwardWmiIrp+0x18b
8f14da8c nt!WmipSendWmiIrp+0x56
8f14dabc nt!WmipDeliverWnodeToDS+0x22
8f14dc28 nt!WmipSendEnableDisableRequest+0x10e
8f14dc4c nt!WmipDoDisableRequest+0x26
8f14dc64 nt!WmipDisableCollectOrEvent+0x35
8f14dc8c nt!WmipDeleteMethod+0x25
8f14dca8 nt!ObpRemoveObjectRoutine+0x13d
8f14dcd0 nt!ObfDereferenceObject+0xa1
8f14dd14 nt!ObpCloseHandleTableEntry+0x24e
8f14dd44 nt!ObpCloseHandle+0x73
8f14dd58 nt!NtClose+0x20
8f14dd58 nt!KiFastCallEntry+0x12a
0012fda4 ntdll!KiFastSystemCallRet
0012fda8 ntdll!NtClose+0xc
0012fde0 ADVAPI32!WmiCloseBlock+0x33
0012fe58 ADVAPI32!PerfRegCloseKey+0x175
0012fe68 ADVAPI32!BaseRegCloseKeyInternal+0x81
0012fe7c ADVAPI32!ClosePredefinedHandle+0x7c
0012feb8 ADVAPI32!RegCloseKey+0x67
0012fed0 ReadTest!GetPerformanceData+0xe5
0012ff38 ReadTest!wmain+0xae
0012ff88 ReadTest!__tmainCRTStartup+0x15e
0012ff94 kernel32!BaseThreadInitThunk+0xe
0012ffd4 ntdll!__RtlUserThreadStart+0x23
0012ffec ntdll!_RtlUserThreadStart+0x1b
Since the sample app from MSDN tries to close the handle every time after calling RegQueryValueEx(), it will disable and enable the disk counter intermittently. The impact to any app using registry API will be that some IO is started with counter disabled with no time stamp recorded and later completed with counter enabled, then generate a huge time difference for such an IO and charge to sec/transfer. KB 2470949 was released to address this issue on Windows 2008 R2.
Resources
Disk Subsystem Performance Analysis for Windows
https://download.microsoft.com/download/e/b/a/eba1050f-a31d-436b-9281-92cdfeae4b45/subsys_perf.doc
How to Calculate Your Disk I/O Requirements
https://technet.microsoft.com/en-us/library/bb125019(EXCHG.65).aspx
Disk Partition Alignment Best Practices for SQL Server
https://msdn.microsoft.com/en-us/library/dd758814(SQL.100).aspx
Counter Types
https://technet.microsoft.com/en-us/library/cc785636(v=WS.10).aspx