Remoting Your Debug Crash Cart With KDNET
This is Christian Sträßner from the Global Escalation Services team based in Munich, Germany.
Back in January, my colleague Ron Stock posted an interesting article about Kernel Debugging using a serial cable: How to Setup a Debug Crash Cart to Prevent Your Server from Flat Lining
Today we look at a new kernel debugging transport introduced in Windows 8 and Windows Server 2012 that makes the cabling much easier, now a network cable can be used as a debug cable. The new KDNET transport utilizes a PCI Ethernet network card in the Target. Most major NIC Vendors have compatible NICs. You can find a list of supported NICs here:
https://msdn.microsoft.com/en-us/library/windows/hardware/hh830880.aspx
Note that this will not work with Wireless or USB attached NICs in the Target.
In the example below, we utilized an Acer AC 100 Server as the Target. It ships with an onboard Intel 82579LM Gigabit NIC:
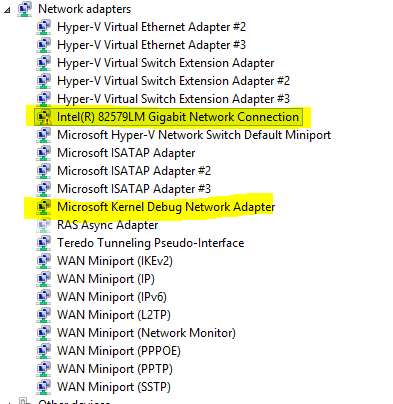
The great thing about KDNET is that the NIC can still be used for normal network activity. The “Microsoft Kernel Debug Network Adapter” driver is the magic behind this. When KDNET.DLL is active, the NIC’s driver will be “banged out” and KDNET takes control of the NIC.
BCD Configuration
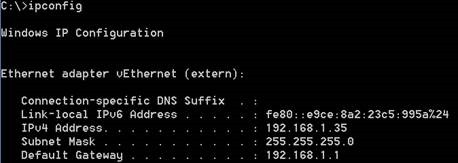
To configure KDNET, you first need to determine the IPv4 Address of the machine with the debugger. In our example, ipconfig.exe tells us that it is 192.168.1.35:
Next go to your Target machine.
The kernel debug settings used to configure KDNET are stored globally in the BCD Store in the {dbgsettings} area. The kernel debug settings apply to all boot entries.
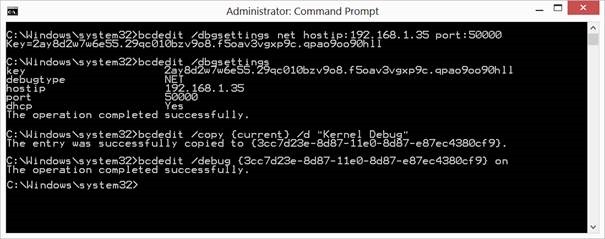
Use bcdedit.exe /dbgsettings net hostip:<addr>port:<port> to set the transport to KDNET, the IP Address of the debugger and the port. You can connect multiple targets to the same debug host by using a different port for each target.
BCD will generate a cryptographic key for you automatically the first time. You can generate a new cryptographic key by appending the ‘newkey’ keyword. Copy the ‘Key’ to a secure location - you will need it in the debugger.
You can display the debug settings using: bcdedit /dbgsettings
Next, for safety, copy the {current} entry to a new entry (bcdedit /copy {current} /d <description> ).
Then enable kernel debugging on the copy (bcdedit.exe /debug {new-guid} on).
If required, also use this (new) entry to enable the checked kernel (bcdedit /set {new-guid} hal <path> and bcdedit.exe /set {new-guid} kernel <path> ).
Debugger
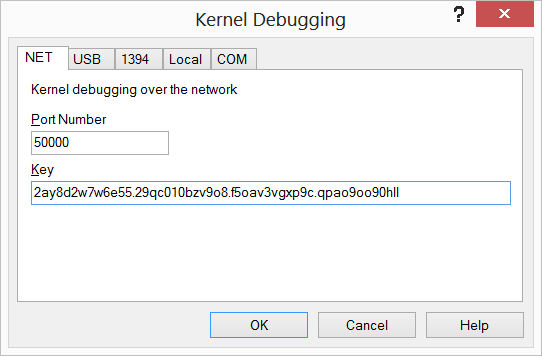
On your Debugger Machine open WinDbg->File->Kernel Debugging (Ctrl-K) and choose the NET tab:
Copy and paste the ‘Key’ here and set the port to the value specified on the Target (the default is 50000):
Next a dialog from Windows Firewall might pop up (depending on your configuration). You want to allow access at this point.
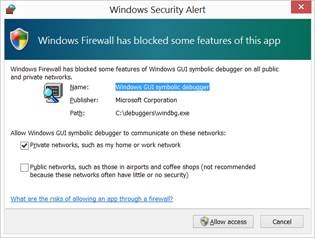
You need to make sure that your debug host machine allows inbound UDP traffic on the configured port (50000 in this example, and by default) for the network type in use.
If your company has implemented IPSec Policies, make sure you have exceptions in place that allow unsecured communication on the port used (KDNET does not talk IPSec).
The Debugger Window will now look like this:
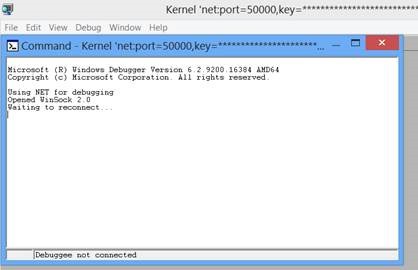
The Debugger is now set up and ready to go.
Reboot the target system now.
When the target comes back online, it will try to connect to the IP Address and Port that was configured with the bcdedit.exe command. The Debugger Command Window will look something like the screenshot below.
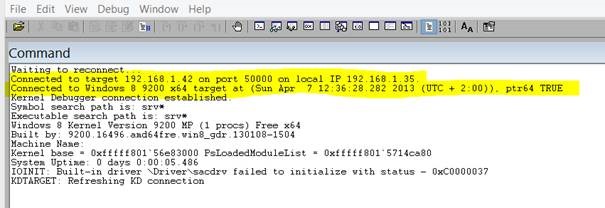
You now can break in as usual. This is a good time to fix your symbol setup if you have not done it yet.
Operation
You still can communicate normally over the NIC and IP that you use on the target. You do not need an additional NIC in the target to use KDNET. When debugging production servers with heavy traffic, we recommend using a dedicated NIC for debugging (note, 10GigE NICs are currently not supported).
If you don’t want the NIC to be used by the OS as well, it can be disabled via: bcdedit.exe -set loadoptions NO_KDNIC

Although you can use KDNET to debug power state transitions (in particular Connected Standby), it is best avoided. The KDNET protocol polls on a regular basis and as such, many systems will not drop to a lower power state. Instead, use USB, 1394, or serial.
Disconnecting the NIC from media (unplugging the NIC in the target machine) is not supported and will most likely blue screen the target machine.
Note 1:
If you have more than one NIC in your target, please read the following (copied from the debugger help):
If there is more than one network adapter in the target computer, use Device Manager to determine the PCI bus, device, and function numbers for the adapter you want to use for debugging. Then in an elevated Command Prompt window, enter the following command, where b, d, and f are the bus number, device number, and function number of the adapter:
bcdedit /set {dbgsettings} busparams b.d.f
Note 2:
If you use the Windows NIC Teaming (LBFO) in Server 2012: KDNET is not compatible with NIC Teaming as indicated by the Whitepaper:
How does it look on the network?
This is a packet sent from the target to the debug host machine.
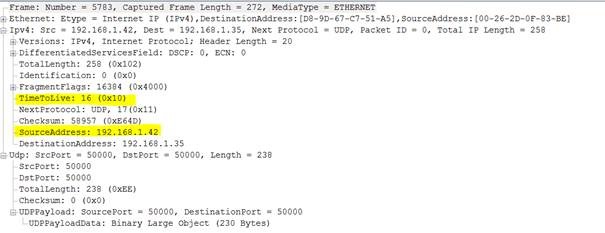
The TTL of the packets sent from the target to the debug host is currently set to 16 (this is not configurable).
This screenshot shows that your connection can only run over 16 IP hops max. This is a theoretical limitation, but it highlights some important facts. Your host is not talking to the Windows IP stack on the target, instead it talks to a basic IPv4/UDP implementation in KDNET. The transport is UDP/IPv4 based, so there is not much tolerance for poor network conditions aside from retry operations at the Debugger Transport Protocol Level.
A few words on performance.
The performance is generally limited by the latency of the link between the host and target. Therefore, even with a LAN like latency (<=1ms), you will not be able to get even close to wire speed of a 1GigE Connection. Expect to see speeds between 1.5 – 2.5Mbytes/s.
Keep this in mind when you plan to pull large portions of memory from the target over KDNET (like the .dump command). This screenshot was taken while executing the .dump /f command (Full Kernel Dump):

Even with the performance restrictions mentioned, KDNET is a valuable extension of the existing debugging methods. It allows you to debug a Windows machine without the need for special hardware (1394) or legacy ports (serial) that not every machine has today (especially tablets and notebooks). It also saves you from using USB2 debugging - which requires special cables and a good amount of hope that the machine’s vendor has attached the single debug capable USB port to an external port on the chassis.
Also, there is no need for you to physically enter the Datacenter where the target is located. You can do all these steps from your convenient office chair. J
To see network kernel debugging in action, watch Episode #27 of Defrag Tools on Channel 9.
Thanks to Andrew Richards and Joe Ballantyne for their help in writing this article.