Troubleshooting Pool Leaks Part 7 – Windows Performance Toolkit
In Part 1 of this series we identified a pool leak in non paged pool. In Part 2 and Part 3 of this series we identified what pool tag was leaking. In Part 5 and Part 6 we got call stacks showing the memory being allocated. In this article we are going to discuss a tool that combines this information into one piece of data.
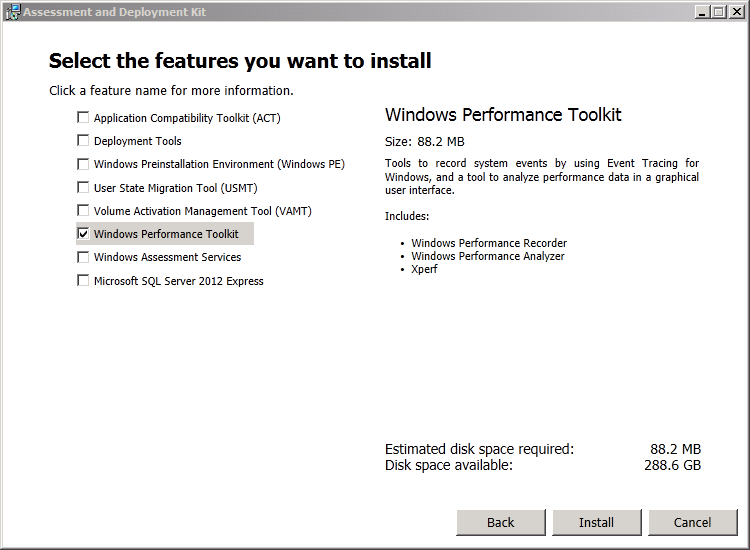
Starting with Windows 7 and Windows Server 2008 R2, Windows has new functionality to track pool allocations and frees using the Windows Performance Toolkit, commonly referred to as xperf. For this example we will be using the WPT from the Windows 8 ADK. When installing the ADK select only the Windows Performance Toolkit option to minimize download time.
Before collecting pool usage data on a 64-bit system, you must disable the paging of data such as drivers and call stacks. The first time you run the Windows Performance Recorder UI and click the Start button you will be prompted that Disable Paging Executive is not set. If you click OK to this dialog WPR will set DisablePagingExecutive and ask that you reboot. To set this ahead of time run the following command from an elevated command prompt, and reboot afterwards:
wpr –disablepagingexecutive on
There are three methods to collect data from a pool leak using the Windows Performance Toolkit. The WPR UI, WPR command line, and xperf command line each provide different methods to collect this data.
Windows Performance Recorder UI:
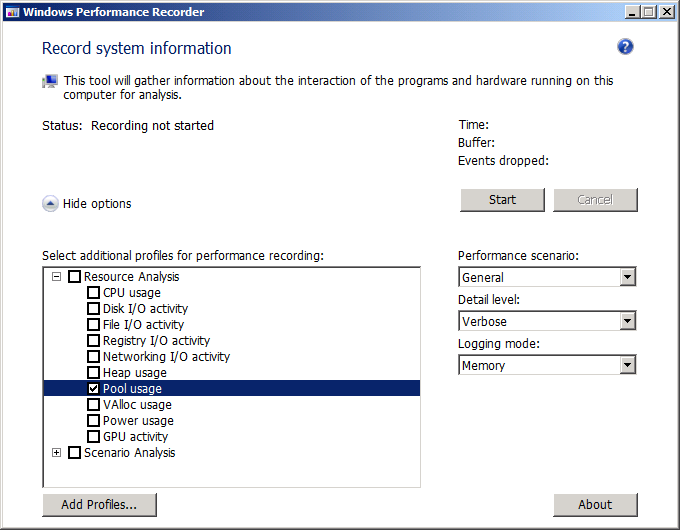
The easiest way to record a trace is with the Windows Performance Recorder, which presents a GUI to make it easy for a user to record a trace. To collect data regarding a pool leak simply check the “Pool usage” checkbox and click the Start button. Reproduce the leak and after a few minutes click the Save button. Use Cancel to stop the trace after your log is saved. Note that by default the WPR will use a circular log in memory, if you record for a long period of time the log will wrap and data will be lost. A sequential file log will be captured by selecting File as the “Logging mode”, however these logs can become very large in a short period of time on a busy system so it is not recommended to leave the log running for longer than a few minutes.
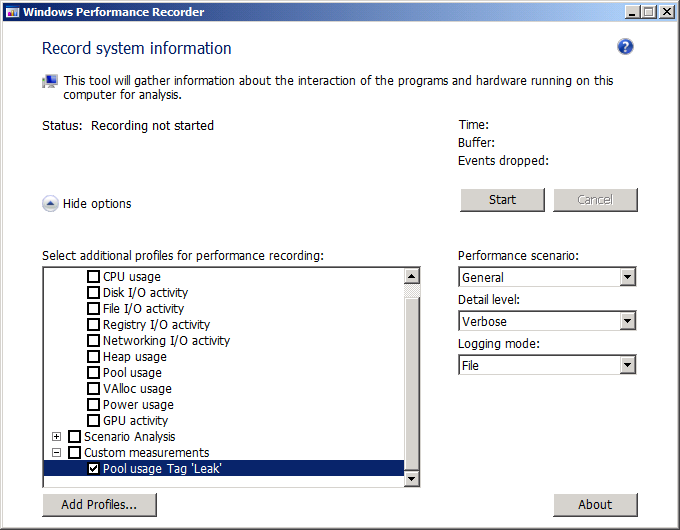
Because these traces can quickly become large, it can be helpful to trace just one pool tag. This can be done in WPR using a custom WPR recording profile. Below is a sample profile that collects pool usage information only for the tag “Leak”, which we identified as the leaking tag in previous articles (Note that you should change the pool tag Leak to the tag you are investigating). Save this text in a file ending in .wprp (ie PoolTagLeak.wprp) and load it in WPR using the Add Profiles button. Check the “Pool usage Tag ‘Leak’” option under Custom measurements. Use the Start button to begin collecting data, reproduce the leak, and use the Save button to save the log. After you have collected the log click Cancel to stop collecting data.
<?xml version="1.0" encoding="utf-8"?>
<WindowsPerformanceRecorder Version="1.0" Author="NTDebugging Blog" Copyright="Microsoft Corporation" Company="Microsoft Corporation">
<Profiles>
<SystemCollector Id="SystemCollector" Name="NT Kernel Logger">
<BufferSize Value="1024" />
<Buffers Value="1024" />
</SystemCollector>
<SystemProvider Id="SystemProvider">
<Keywords>
<Keyword Value="Pool" />
</Keywords>
<Stacks>
<Stack Value="PoolAllocation" />
<Stack Value="PoolAllocationSession" />
</Stacks>
<PoolTags>
<PoolTag Value="Leak"/>
</PoolTags>
</SystemProvider>
<Profile Id="PoolUsage.Verbose.File" Name="PoolUsage" Description="Pool usage Tag 'Leak' " LoggingMode="File" DetailLevel="Verbose">
<Collectors>
<SystemCollectorId Value="SystemCollector">
<SystemProviderId Value="SystemProvider" />
</SystemCollectorId>
</Collectors>
</Profile>
<Profile Id="PoolUsage.Verbose.Memory" Name="PoolUsage" Description="Pool usage Tag 'Leak'" Base="PoolUsage.Verbose.File" LoggingMode="Memory" DetailLevel="Verbose" />
</Profiles>
</WindowsPerformanceRecorder>
Windows Performance Recorder command line:
WPR can also be run from a command line if you need to script its operation, or if you prefer typing text over clicking buttons. By default WPR will be installed at C:\Program Files (x86)\Windows Kits\8.0\Windows Performance Toolkit\wpr.exe.
To start a trace, run the following from a command line:
wpr -start GeneralProfile -start Pool
To save the trace run:
wpr –stop pool.etl “pool leak”
Cancel the trace with:
wpr -cancel
Optionally, you can use the custom profile defined earlier in this article to trace just one pool tag. This command assumes PoolTagLeak.wprp is in the same folder as wpr.exe, use the full path if your custom profile is located elsewhere. Save and cancel the trace using the above steps.
wpr -start PoolTagLeak.wprp
Xperf command line:
The third way to enable this tracing is with xperf. This is an older tool which has been replaced by WPR, however xperf provides a circular logging functionality that isn’t available in WPR. Circular logging can be useful if you need to run xperf over a longer period of time. The below command enables tracing with xperf for the pool tag Leak using a circular buffer. Note that you should change the pool tag Leak to the tag you are investigating.
xperf -on Base+CSwitch+POOL -stackwalk PoolAlloc+PoolAllocSession –PoolTag Leak -BufferSize 1024 -MaxBuffers 1024 -MaxFile 1024 –FileMode Circular
To save and cancel the xperf trace in one command:
xperf -d pool.etl
Analyzing data with Windows Performance Analyzer:
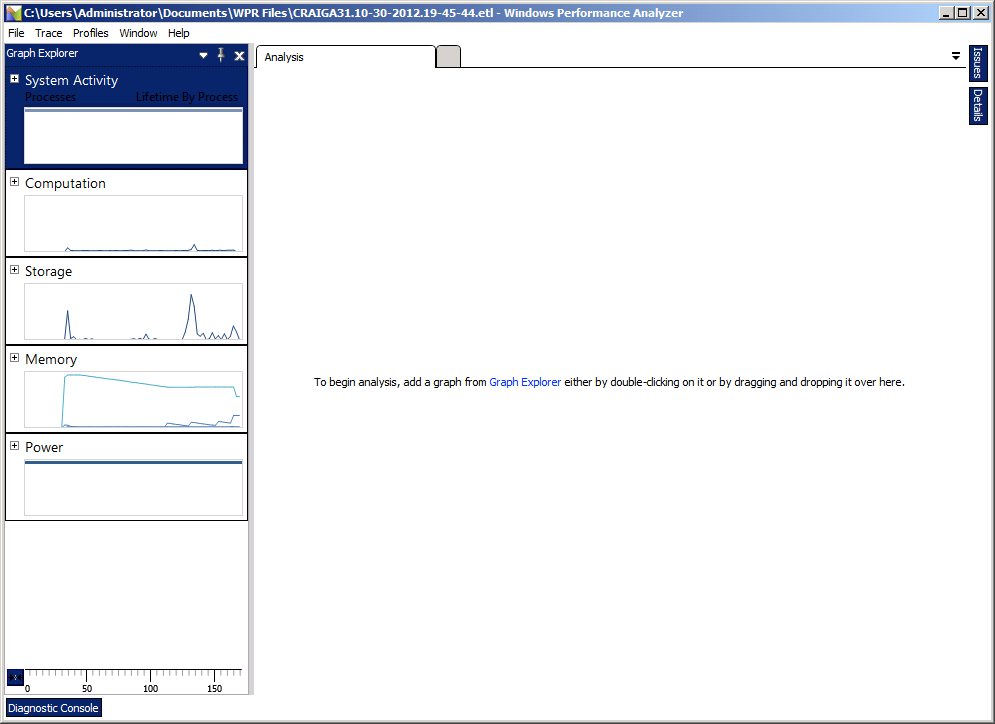
After you have collected a trace using the method that works best for your scenario, open the etl file in the Windows Performance Analyzer. The below output is from a trace collected with WPR.
Pool analysis will require symbols. Configure the symbol path using the option in the Trace menu. Often the symbol path will be pre-populated, if it is not use srv*c:\symbols*https://msdl.microsoft.com/download/symbols. Click the Load Symbols option from the Trace menu, and be patient while WPA downloads symbols from the symbol server.
In the Graph Explorer click the + next to Memory to drop down the available memory graphs. Right click the Pool Total Allocation Size graph and choose Add graph to New Analysis View. If you are working with a small resolution screen you may want to click the X at the top of the Graph Explorer to close it, the Graph Explorer can be restored from the Window menu.
The key to effective xperf analysis is to sort the data by the appropriate columns. Columns can be added to the chart at the bottom of the view by right clicking the header and choosing the appropriate fields. To perform pool analysis the Type, Paged, Pool Tag, and Stack columns are necessary. Drag each of these columns to the left of the yellow line and sort them in the order shown below. Click the Size column to sort it as the primary.
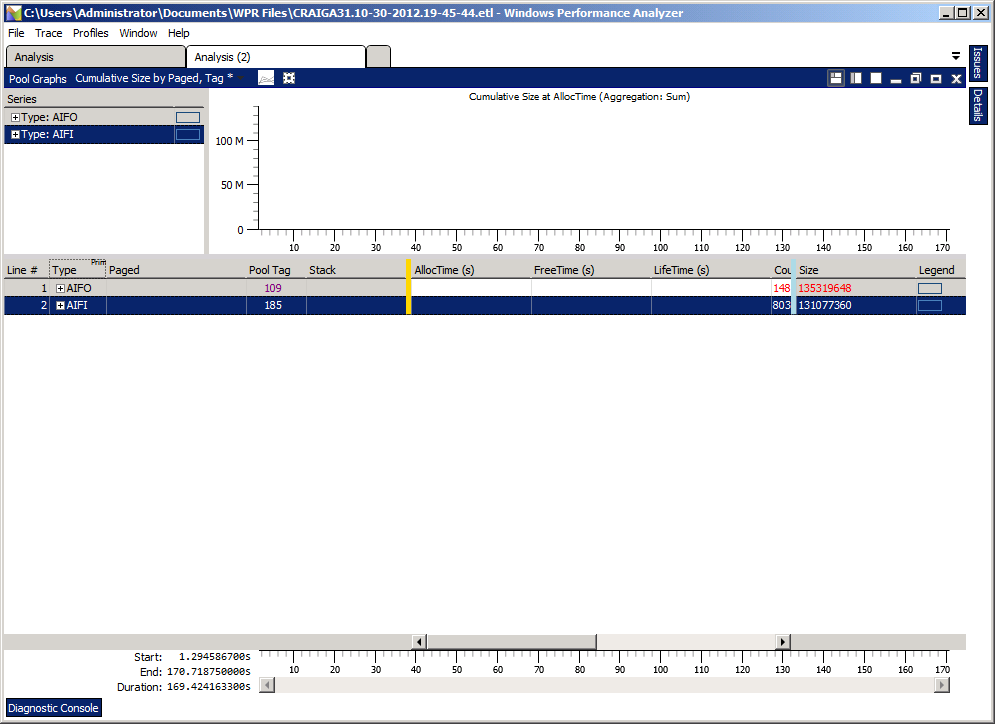
The Type column indicates when the pool memory was allocated and when it was freed. The term “AIFO” means the pool was Allocated Inside the timeframe of the trace and it was Freed Outside the timeframe of the trace (or perhaps it was never freed at all). The term “AIFI” means the pool was Allocated Inside the timeframe of the trace, and it was also Freed Inside the timeframe of the trace (this memory was not leaked). Because we are interested in memory that was not freed, start by clicking the + next to AIFO.
The Paged column indicates if the pool allocations recorded are Paged or NonPaged. From the perfmon analysis in Part 1 we know that the leak we are troubleshooting in this example is in NonPaged pool. If a perfmon log is not available, the Size column is an indicator of what type of pool was leaked. Click the + next to whichever type of pool is largest in your trace.
The Pool Tag column displays the pool tag associated with each pool allocation. Again, the Size column is an indicator of which tag is leaking. Click the + next to the largest pool tag in your trace.
The Stack column displays the call stack leading up to the allocation. This is the information we are most interested in, it will indicate what driver is allocating the pool and it may indicate why. Click the + next to the largest Stack in your trace. Depending on how many times a particular code path is repeated, your Stack may only partially display and there may be more + options, you can use the right arrow key as a shortcut to open each of these until you see the call to ExAllocatePool. When the complete stack has been displayed the right arrow key will stop expanding stacks.
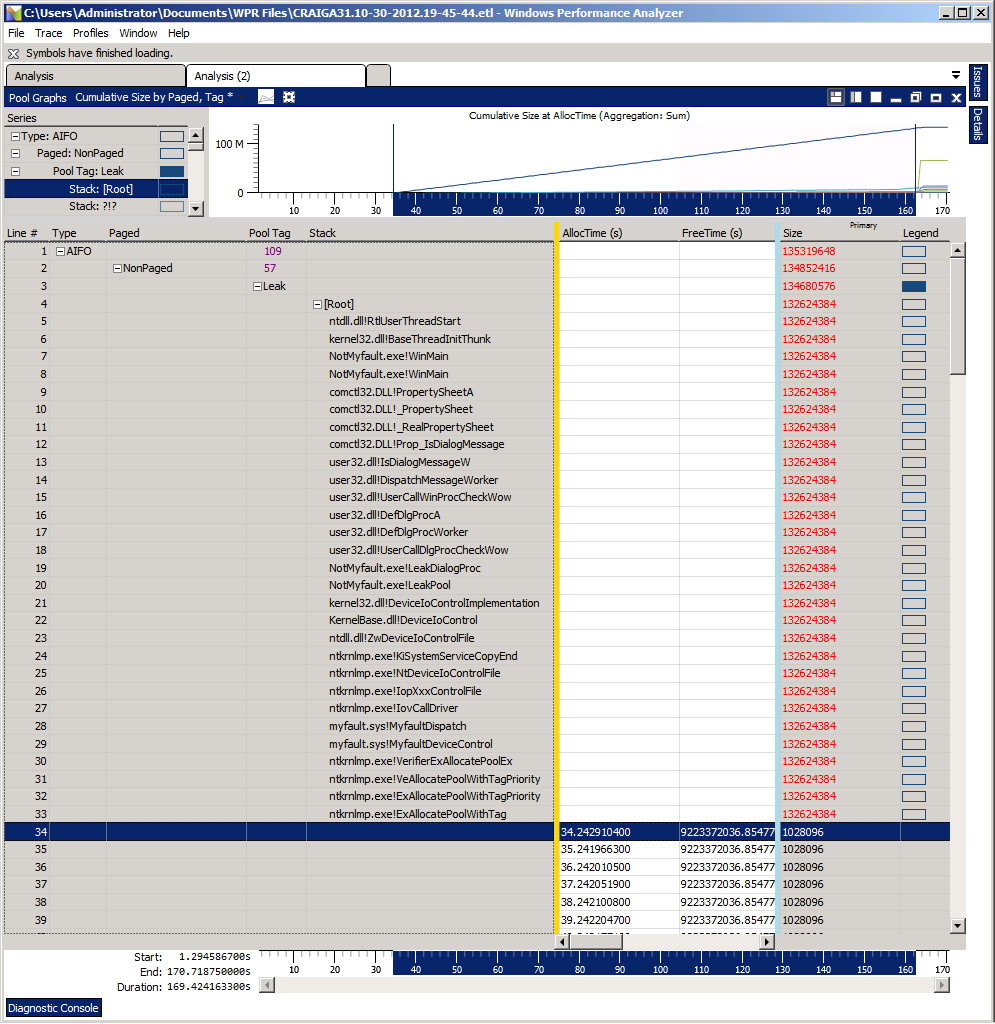
In the above output we can see that there was a NonPaged pool leak in the tag Leak. The call stack shows that the allocations were made by myfault.sys. A driver developer would have a great use for this information. If this was data from an actual leak the developer would use this output to determine that the leak is occurring due to an IOCTL sent from NotMyfault.exe!WinMain which leads to an allocation made in myfault.sys!MyfaultDeviceControl. A developer can use this information to perform a code review and identify under what conditions MyfaultDeviceControl allocates this pool, under what conditions it should be expected to free it, and why it may not free the memory.
This article concludes our series on troubleshooting pool leaks. We have demonstrated various techniques which each have their own strengths and weaknesses. Each of these techniques has a place in your debugging toolkit and are applicable to different circumstances depending on what your scenario is and what data you have available.