I Want A Debugger Robot
Hi,
My name is Sabin from the Platforms Global Escalation Services team at Microsoft, and today I want to share with you a recent experience I had debugging an issue reported by an hardware manufacturer.
The customer was doing a reboot test for their new server product line. They found that after hundreds of continuous reboots there was always a single instance that the server took more than 20 minutes to start up, when compared to an average 2 minute normal startup time. This happened only once every 300+ to 1000+ reboots. The number of reboots it took before the problem happened again varied randomly so it was difficult to predict when the problem would occur.
Although they setup a live kernel debugging environment, they didn’t want to watch the computer screen for 10+ hours waiting for the problem to happen so they could manually hit Ctrl+Break in windbg. So instead they setup a video camera to film the computer screen 24x7, and they managed to find that when the “mysterious delay” happened the computer showed a gray screen with “Microsoft (R) Windows (R) version 5.1 (Build 3790: Service Pack 2) ”.
The case came to me and the customer even shipped a problematic server to our office to troubleshoot the cause of the delay. The problem was that I didn’t want to stare at the computer screen for 10+ hours either!
The first thing I thought was that it would be fantastic if there were a robot sitting in front of Windbg, watching the elapsed time for each reboot, so it could hit Ctrl+Break in windbg if the server takes more than 10 minute to start. Then I asked myself, “Why not?”
I decided to build such a “robot” myself. I went around and checked the Debuggers SDK document (which can be found in the windbg help document debugger.chm), and I realized that what I needed was a customized debugger. The functionality of the debugger is simple, it should be able to recognize the time when the server first starts and the time when the server reboots. If there is more than 10 minutes between these two times the customized debugger automatically breaks in to the server. The event callback interface IDebugEventCallbacks::SessionStatus and the client interface IDebugControl::SetInterrupt can meet my needs perfectly.
It is not that difficult to build such a customized debugger, which I called DBGRobot. I would like to share some code snippets which you may find helpful when building a customized debugger for a special debugging scenario, or as the basis for building a more complicated debugging robot.
First, we need to download and install the Windows Driver Kit Version 7.1.0. When installing the WDK be sure to select Debugging Tools for Windows.
https://www.microsoft.com/whdc/DevTools/WDK/WDKpkg.mspx
If you install the WDK to its default folder, which for version 7.1.0 is C:\WinDDK\7600.16385.1, the C:\WinDDK\7600.16385.1\Debuggers\sdk\samples folder will contain the sample code from the Debugger SDK. The dumpstk sample is the one particularly interesting to us. We can copy some common code from it, such as the out.cpp and out.hpp which is the implementation of the IDebugOutputCallbacks interface.
Now let’s do some coding. The common code is copied from the Debuggers SDK sample Dumpstk. I also listed it here for clarity.
The first step is to create the IDebugClient, IDebugControl and IDebugSymbols interfaces (although IDebugSymbols is not used in this case). You need to call the DebugCreate() function to create the IDebugClient interface, and then use IDebugClient->QueryInterface() to query the IDebugControl and IDebugSymbols interfaces.
void
CreateInterfaces(void)
{
HRESULT Status;
// Start things off by getting an initial interface from
// the engine. This can be any engine interface but is
// generally IDebugClient as the client interface is
// where sessions are started.
if ((Status = DebugCreate(__uuidof(IDebugClient),
(void**)&g_Client)) != S_OK)
{
Exit(1, "DebugCreate failed, 0x%X\n", Status);
}
// Query for some other interfaces that we'll need.
if ((Status = g_Client->QueryInterface(__uuidof(IDebugControl),
(void**)&g_Control)) != S_OK ||
(Status = g_Client->QueryInterface(__uuidof(IDebugSymbols),
(void**)&g_Symbols)) != S_OK)
{
Exit(1, "QueryInterface failed, 0x%X\n", Status);
}
}
If you want to see the output from the debugging engine, you also need to implement the IDebugOutputCallbacks interface. The main function to be implemented is IDebugOutputCallbacks::Output(), which is quite simple as we only need to see the output in the command prompt stdout stream:
STDMETHODIMP
StdioOutputCallbacks::Output(
THIS_
IN ULONG Mask,
IN PCSTR Text
)
{
UNREFERENCED_PARAMETER(Mask);
fputs(Text, stdout);
return S_OK;
}
Here comes our main code logic: we need to implement the IDebugEventCallbacks interface and monitor the SessionStatus events. In order for the debugger engine to deliver the SessionStatus events to us we need to set the DEBUG_EVENT_SESSION_STATUS mask in IDebugEventCallbacks::GetInterestMask():
STDMETHODIMP_(HRESULT)
RobotEventCallBacks::GetInterestMask(
THIS_
OUT PULONG Mask
)
{
// Here we monitor all the event types, although it is not necessary
*Mask = DEBUG_EVENT_SESSION_STATUS | DEBUG_EVENT_EXCEPTION | DEBUG_EVENT_CHANGE_DEBUGGEE_STATE | DEBUG_EVENT_CHANGE_ENGINE_STATE;
return S_OK;
}
In the RobotEventCallBacks::SessionStatus() function, if we receive the DEBUG_SESSION_ACTIVE session status we know that Windows has started and connected to the debug session. Once the OS has started we create a new thread that waits for hEvent, an unnamed global event. In the new thread we send a timeout value for 10 minutes to the WaitForSingleObject() call. The hEvent will be set when the session status is DEBUG_SESSION_END or DEBUG_SESSION_REBOOT, which means that the server rebooted and disconnected from the debug session. If WaitForSingleObject() returns WAIT_TIMEOUT, indicating that the server has not rebooted after 10 minutes, we send a break to the server via g_Control->SetInterrupt(DEBUG_INTERRUPT_ACTIVE).
STDMETHODIMP_(HRESULT)
RobotEventCallBacks::SessionStatus(
THIS_
IN ULONG Status
)
{
printf("Session Status changed, status = %d \n", Status);
if (Status == DEBUG_SESSION_ACTIVE)
{
//bSessionActive = TRUE;
::CreateThread(NULL, 0, (LPTHREAD_START_ROUTINE)TimerThread, NULL, 0, NULL);
}
else if ((Status == DEBUG_SESSION_END) || (Status == DEBUG_SESSION_REBOOT) )
{
//bSessionActive = FALSE;
SetEvent(hEvent);
}
return S_OK;
}
STDMETHODIMP_(HRESULT)
RobotEventCallBacks::Exception(
THIS_
IN PEXCEPTION_RECORD64 Exception,
IN ULONG FirstChance
)
{
printf("Captured exception 0x%x, FirstChance = %d", Exception->ExceptionCode, FirstChance);
if (FirstChance && Exception->ExceptionCode == 0x80000003)
{
bInterrupted = TRUE;
}
return DEBUG_STATUS_NO_CHANGE;
}
void TimerThread()
{
HRESULT Status;
DWORD result;
result = WaitForSingleObject(hEvent,10*60*1000);
if (result == WAIT_OBJECT_0) //the close event is signled within 10 minutes
{
printf("Target reboots within 10 minutes \n");
}
else if (result == WAIT_TIMEOUT) //the close event is not singled within 10 minute, it means the server hangs
{
if ((Status = g_Control->SetInterrupt(DEBUG_INTERRUPT_ACTIVE)) !=S_OK) //force the target to break
{
Exit(1, "SetInterrupt failed, 0x%x\n", Status);
}
}
}
Below is our main function. In the main function we need to create the interfaces, and set the callback interfaces g_Client->SetOutputCallbacks and g_Client->SetEventCallbacks. Then we call g_Control->WaitForEvent() in the while(TRUE) loop, which is a typical main loop for a debugger program. If WaitForEvent() returns it means that a debugging event happened, such an exception, and then you can send some debug commands via g_Control->Execute. Here we simply send a “.time” command to record the problematic time. The bInterrupted boolean is set in the RobotEventCallBacks::Exception() function when it detects a first chance 80000003 exception, which means a debugger break-in.
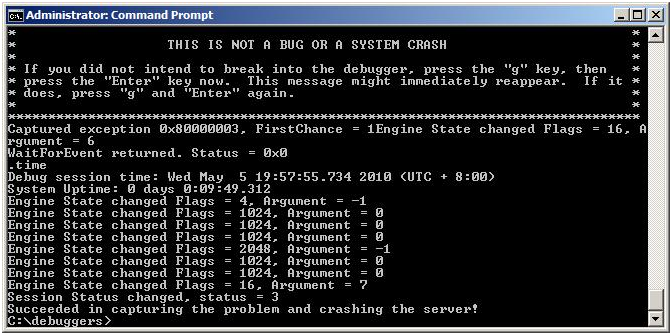
Note: Initially I wanted to send a “.crash” command to crash the server and generate the memory dump. When I tried this I found that although the “.crash” command did trigger a blue screen it failed to generate a memory dump because the problem happened so early in the boot process and the paging file was not initialized yet. So I changed it to just send a “.time” command and performed live debugging after the problem was captured by the tool. Initially I had forgotten to change the printf output, which is why you see the output “Succeeded in capturing the problem and crashing the server!” in the below screenshot.
void __cdecl
main(int argc, char* argv[])
{
HRESULT Status;
hEvent = CreateEvent(NULL, FALSE, FALSE, NULL); //create the global hEvent
CreateInterfaces(); //create the global interfaces
if ((Status = g_Client->SetOutputCallbacks(&g_OutputCb)) != S_OK) //set the output callback interface
{
Exit(1, "SetOutputCallbacks failed, 0x%X\n", Status);
}
if ((Status = g_Client->SetEventCallbacks(&g_EventCb)) != S_OK) //Set the event callback interface
{
Exit(1, "SetEventCallbacks failed, 0x%X\n", Status);
}
Status = g_Client->AttachKernel(DEBUG_ATTACH_KERNEL_CONNECTION, argv[1]); //Attach to the kernel debugging, the argv[1] should be “COM:Port=COM1,baud=115200”
if (Status != S_OK)
{
Exit(1, "AttachKernel failed, 0x%X\n", Status);
}
while(TRUE) //This is the main loop of the debugger program, it calls g_Control->WaitForEvent() repeatedly waiting for the debugging events
{
Status = g_Control->WaitForEvent(DEBUG_WAIT_DEFAULT,
INFINITE); //wait for 10 minutes
printf("WaitForEvent returned. Status = 0x%x\n", Status);
if (Status == S_OK && bInterrupted)
{
if ((Status = g_Control->Execute(DEBUG_OUTCTL_THIS_CLIENT, ".time", DEBUG_EXECUTE_ECHO)) !=S_OK) //do .time to record the time the problem happens
{
Exit(1, "Execute failed, 0x%x\n", Status);
}
Exit(0, "Succeeded in capturing the problem!");
}
}
Exit(0, NULL);
}
Now that we have the code we can build DBGRobot.exe using the WDK 7.1.0 build environment. Remember to set the following environment variables, as mentioned in the readme.txt under \WinDDK\7600.16385.1\Debuggers\samples
SET DBGLIB_LIB_PATH=C:\WinDDK\7600.16385.1\Debuggers\sdk\lib
SET DBGSDK_INC_PATH=C:\WinDDK\7600.16385.1\Debuggers\sdk\inc
SET DBGSDK_LIB_PATH=C:\WinDDK\7600.16385.1\Debuggers\sdk\lib
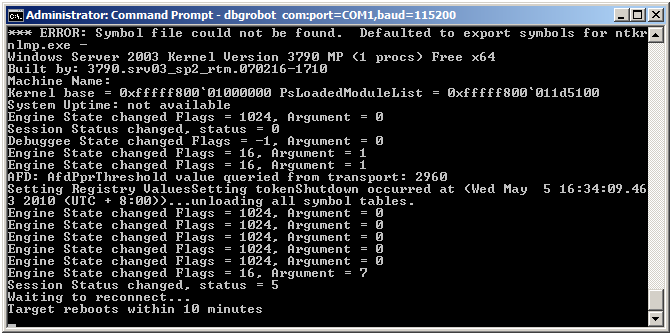
Now I have the “robot” watching the problem for me. I set up the live kernel debugging environment as usual and then ran the DBGRobot.exe tool as the debugger instead of windbg. I used the command: dbgrobot.exe com:port=COM1,baudrate=115200.
This is the screenshot when the server starts and reboots normally:
I let the DBGRobot.exe run over night, and in the morning when I came back to the office, the “robot” had done its job perfectly and captured the problem for me! The problematic server was left in the break-in state so I just needed to launch windbg to attach to the server, and then I could do the debugging in windbg as normal.
The cause of the delay turned out to be a hardware problem, but the actual problem is not important here. I hope this article can give you some new ideas about debugging, and using the debug tools in new ways.

