Capturing ADPlus CLR crashes
Trey Nash here again, and I would like to discuss a scenario we are all too familiar with. You’ve worked your tail off for the past year, and for the past couple of months you even worked evenings and weekends. Management rewarded your team with two weeks off in appreciation of your efforts. But now that you’re back in the office, you’re hearing rumors percolating up from your tech support department that there are some cases where your application is crashing in the field for mysterious reasons. What do you do?
The application happens to have been built with an unhandled exception filter registered via the AppDomain.UnhandledException event. Therefore, you at least know that the application is failing with an InvalidCastException, but you cannot imagine why this is happening.
Wouldn’t it be nice if you could live debug on the affected system? Unless you work on-site for your customer or your software is on a laptop and your customer is willing to send it to you, then I doubt you will get this opportunity. What you need is a tool to capture the state of your application while it is failing. Then the customer could capture this information and send it to you.
Enter ADPlus. ADPlus is a free tool in the Debugging Tools for Windows package that scripts the CDB debugger allowing you to capture dumps for one or multiple processes on a system. It also offers the following advantages:
· ADPlus can monitor desktop applications, services, etc.
· ADPlus can monitor multiple processes on the system. When it collects a dump of those processes, it freezes and dumps them simultaneously. This is essential for tracking down problems with inter-process communications.
· ADPlus supports xcopy deployment meaning the customer does not need to install anything via Windows Installer, etc. This minimizes configuration changes on the machine, and that is music to customers’ ears.
Note: Although ADPlus is xcopy installable, you still have to install the Debugging Tools for Windows package via Windows Installer as that is the only way Microsoft distributes it. However, once you have installed Debugging Tools for Windows once, you can xcopy deploy ADPlus or the entire Debugging Tools for Windows package to another machine. In fact, during development, I find it extremely handy to check in the development tools into the source repository. Debugging Tools for Windows supports this by virtue of the fact that it is xcopy installable.
For those of you that are savvy with Windows Installer, you can perform an admin install using the msi for Debugging Tools for Windows and that will allow you to extract the files without actually installing the package on the machine, for example:
msiexec /a dbg_x86_6.11.1.404.msi
With all of that said, let’s see how ADPlus can help you diagnose problems with .NET applications.
The Sample Application
In the rest of this post, I will reference the C# 3.0 sample application that I have put together to illustrate using ADPlus to capture an unhandled exception in a .NET application. The code is listed below:
using System;
using System.Linq;
using System.Runtime.Serialization;
class A
{
public void SaySomething() {
Console.WriteLine( "Yeah, Peter...." );
throw new BadDesignException();
}
}
class B : A
{
}
class C
{
}
class EntryPoint
{
static void Main() {
DoSomething();
}
static void DoSomething() {
Func<int, object> generatorFunc = (x) => {
if( x == 7 ) {
return new C();
} else {
return new B();
}
};
var collection = from i in Enumerable.Range( 0, 10 )
select generatorFunc(i);
// Let's iterate over each of the items in the collection
//
// ASSUMING THEY ARE ALL DERIVED FROM A !!!!
foreach( var item in collection ) {
A a = (A) item;
try {
a.SaySomething();
}
catch( BadDesignException ) {
// Swallow these here. The programmer chose to
// use exceptions for normal control flow which
// is *very* poor design.
}
}
}
}
public class BadDesignException : Exception
{
public BadDesignException() { }
public BadDesignException( string msg ) : base( msg ) { }
public BadDesignException( string msg, Exception x ) : base( msg, x ) { }
protected BadDesignException( SerializationInfo si,
StreamingContext ctx )
:base( si, ctx ) { }
}
You can compile this sample code easily by putting it in a file, such as test.cs, and then from either a Visual Studio Command Prompt or from a Windows SDK Command Shell, execute the following:
csc /debug+ test.cs
Note: The code is contrived and there are many bad things about this code from a design/coding standpoint, but that is intentional for the sake of illustration. For example, one may want to re-think introducing a collection that contains references to System.Object.
The code above also uses features that are new to C# 3.0 (for brevity) including lambda expressions and LINQ. If you would like to become more familiar with them, visit the C# website on MSDN or reference one of the excellent books on C# such as Pro LINQ or Accelerated C# 2008.
The notable section of the code to focus on is the foreach loop within the EntryPoint.Main() method. In that foreach loop, we are iterating over a collection of objects where we are assuming that they all derive from type A. Thus the code attempts to cast all instances to a reference of type A and since I have intentionally put an instance of type C within that collection, it will fail at some point with an exception of type System.InvalidCastException.
Capturing the Problem
Using ADPlus in crash mode, we can capture the exception in the customer’s environment. To illustrate this in action, let’s launch ADPlus in crash mode and monitor the test.exe example application built above by using the following command line:
adplus -crash -o c:\temp\test -FullOnFirst -sc c:\temp\test\test.exe
Note: I built and tested this code in a directory named c:\temp\test on my machine as I wrote this. Therefore, you will see references to it throughout this post. Incidentally, I have found ADPlus is a lot easier to use if you feed it fully qualified paths. If you get mysterious errors or behavior, and you are using relative paths with ADPlus, try fully qualifying the paths before you beat your head against the wall for too long trying to figure out what could be going wrong.
ADPlus is easier to launch if you add the directory where the Debugging Tools for Windows was installed to your PATH environment variable. The command line above assumes this has been done. Now, let me explain the command line options that I used above. I highly recommend that you become familiar with all of the ADPlus command line options.
· -crash launches ADPlus in crash mode. This is the mode you want to use if your application is failing because of an unhandled exception.
· -o c:\temp\test tells ADPlus that I want the output to be placed in c:\temp\test, which is the directory in which I built the test.exe application.
· -FullOnFirst is very important for managed applications.. This tells ADPlus to grab a full process dump on first chance exceptions. It is essential that you capture full dumps for managed applications, otherwise, all of the necessary data regarding the execution engine and the managed heap will be absent from the dump making it impossible to debug effectively.
· -sc c:\temp\test.exe is only one of the ways you can point ADPlus to an application to monitor. In this case, we’re instructing ADPlus to tell the debugger to explicitly launch the application. Had it been a service, or if the application you want to monitor is already running, we would probably have used –p to attach to its PID or –pn to attach to the process by name. Notice that I provided the full path to the application.
After you launch ADPlus, you are presented with the following dialog unless you use the –quiet option.
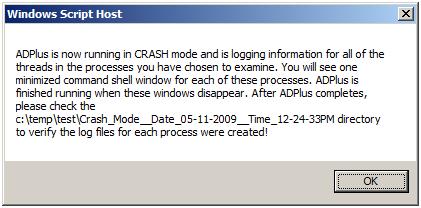
Once the application is finished executing, go to the directory that you specified in the ADPlus –o command line option and you should see a subdirectory named similarly to what you see in the previous dialog snapshot. For the instance of test.exe I just executed, that directory is named Crash_Mode__Date_05-11-2009__Time_21-12-54PM. Under that directory, there are quite a few files that I have listed below:
C:\temp\test\Crash_Mode__Date_05-11-2009__Time_21-12-54PM>dir /b
ADPlus_report.txt
CDBScripts
PID-0__Spawned0__1st_chance_CPlusPlusEH__full_15ac_2009-05-11_21-13-01-332_0eac.dmp
PID-0__Spawned0__1st_chance_NET_CLR__full_15ac_2009-05-11_21-12-55-482_0eac.dmp
PID-0__Spawned0__1st_chance_NET_CLR__full_15ac_2009-05-11_21-12-56-527_0eac.dmp
PID-0__Spawned0__1st_chance_NET_CLR__full_15ac_2009-05-11_21-12-57-370_0eac.dmp
PID-0__Spawned0__1st_chance_NET_CLR__full_15ac_2009-05-11_21-12-58-103_0eac.dmp
PID-0__Spawned0__1st_chance_NET_CLR__full_15ac_2009-05-11_21-12-58-867_0eac.dmp
PID-0__Spawned0__1st_chance_NET_CLR__full_15ac_2009-05-11_21-12-59-663_0eac.dmp
PID-0__Spawned0__1st_chance_NET_CLR__full_15ac_2009-05-11_21-13-00-505_0eac.dmp
PID-0__Spawned0__1st_chance_NET_CLR__full_15ac_2009-05-11_21-13-02-689_0eac.dmp
PID-0__Spawned0__1st_chance_Process_Shut_Down__full_15ac_2009-05-11_21-13-27-743_0eac.dmp
PID-0__Spawned0__2nd_chance_NET_CLR__full_15ac_2009-05-11_21-13-04-140_0eac.dmp
PID-0__Spawned0__Date_05-11-2009__Time_21-12-54PM.log
Process_List.txt
For each first chance exception, a dump file (.dmp) has been collected. Notice that the dump files can tend to be very large because of the –FullOnFirst option. You can subsequently load these dump files into either Windbg (or its variants) or the Visual Studio Debugger. Personally, I prefer Windbg because I can then load the SOS extension along with the SOSEX extension and dig into the state of the application and the CLR.
Using the ADPlus default configuration as we have above, you can see that ADPlus generated dumps for one first-chance C++ exception, eight first-chance CLR exceptions, one second-chance CLR exception and one dump collected during process shut down.
What is Included in the Output
If you look in your Debugging Tools for Windows directory, you’ll notice that ADPlus is really just a very complex VBScript. It generates quite a bit of useful information along with any problem dump files. ADPlus_report.txt reports the configuration for ADPlus for this run. This is handy if you need to know what it will do for a specific type of exception.
Process_list.txt is generated from executing tlist.exe, another tool that comes with Debugging Tools for Windows.
And finally, the CDBScripts subdirectory contains a .cfg file which is the exact debugger script ADPlus generated and subsequently fed to CDB to get the job done. On my machine, when running against the sample application using the command line from the previous section, this file is named PID‑0__Spawned0.cfg. If you’re ever curious or need to know exactly what ADPlus instructed the debugger to do, this file is the source.
Note: The reason the name contains a zero PID is because we used the –sc option to launch the application. Had we used the –p or –pn option, the PID in the filename would not be zero.
I don’t recommend executing this debugger script in a live debugger as doing so could overwrite the data that you already have collected. Instead, if you need to couple ADPlus with live debugging, you should use the –gs option which I will describe shortly.
Pinpointing a Specific Exception
You’ll notice that in the previous run of ADPlus, quite a few dump files were generated and each one was fairly large. In reality, there are times where a first chance exception does not always indicate a fatal situation. In Accelerated C# 2008, I go into detail regarding how it is poor design practice to implement any sort of control flow or otherwise reasonably expected behavior using exceptions. This is because exceptions are supposed to be truly exceptional events! For more juicy details on how expensive exceptions are, I invite you to read an excellent blog post by Tess Ferrandez on the topic. At any rate, you may encounter situations where you get a lot of dumps for first chance exceptions you are not interested in as this example shows..
To alleviate this situation, you can create an ADPlus configuration file coupled with the !StopOnException command provided by the SOS extension to instruct ADPlus to filter out only the exceptions you’re interested in. To do this, I created a configuration file named filter.config with the following contents:
<ADPlus>
<!-- Configuring ADPlus to log only exceptions we're interested in -->
<Exceptions>
<Config>
<!-- This is for the CLR exception -->
<Code> clr </Code>
<Actions1> Log </Actions1>
<CustomActions1> .loadby sos mscorwks; !StopOnException System.InvalidCastException 1; j ($t1 = 1) '.dump /ma /u c:\dumps\InvalidCastException.dmp; gn' ; 'gn' </CustomActions1>
<ReturnAction1> VOID </ReturnAction1>
<Actions2> Log </Actions2>
</Config>
</Exceptions>
</ADPlus>
Note: The <CustomActions1> element above is meant to be in one line in the config file.
The <CustomActions1> element is the element of interest in this configuration file. This element allows you to specify which commands the debugger should execute on first chance exceptions. Within this element, you can put any valid debugger commands (except windbg GUI-related commands). If you need to execute multiple commands, as I have above, you simply separate them with semicolons. In the <CustomActions1> element shown above, I first load the SOS extension using the .loadby command. Then, I use the !StopOnException command in predicate mode to set the $t1 pseudo-register to 1 if the exception is of type System.InvalidCastException and 0 otherwise. Then, the following j command is used to create a full dump if $t1 is 1 and do nothing otherwise. The gn command in both paths of the j command tells the debugger to go unhandled so that the exception is propagated up rather than swallowed by the debugger. If you were to go handled, thus swallowing the exception, the exception handlers in the code would never see it and the debugger would alter the behavior of the application. And finally, note that the .dump command used to create the dump indicates the path where the dump will be stored. In this case, I am placing it in the c:\dumps directory on my machine.
Now you can provide this configuration file to ADPlus using the following command:
adplus -crash -o c:\temp\test -FullOnFirst -c c:\temp\test\filter.config -sc c:\temp\test\test.exe
Notice that there are fewer dumps collected. Along with the dump for the InvalidCastException, it also captures a C++ exception as well as when the application shuts down. If you open the C++ exception dump in the debugger and inspect the stack, it shows that the CLR is in the process of generating the InvalidCastException. The CLR catches the C++ exception and converts it into a managed exception. The C++ exception dump was generated because I left the –FullOnFirst option in the previous command line. You can eliminate the C++ exception dump by removing -FullOnFirst.
Using ADPlus during Live Debugging
I already hinted at the –gs ADPlus command line option earlier in this post. This option allows you to create the debugger scripts ADPlus creates without actually running them in the debugger. For example, if you execute the following command (I executed mine from my c:\temp\test directory):
adplus -crash -o c:\temp\test -FullOnFirst -c c:\temp\test\filter.config -gs livedebug
You will notice that ADPlus does not actually launch any debugger or your application. Rather, it creates a subdirectory named livedebug. When you go into that directory, you’ll notice it looks similar in layout to the crash directories created in the previous demonstration. On my machine, I end up with the following two files:
C:\temp\test\livedebug\ADPlus_report.txt
C:\temp\test\livedebug\CDBScripts\PID-0__livedebug.cfg
The PID-0__livedebug.cfg file is actually a debugger script file containing debugger commands. All we have to do now is launch our test application in the debugger and then execute this script. Within my c:\temp\test directory, I can launch the debugger using the following command:
windbg test.exe
Once inside the debugger, I can invoke the ADPlus debugger script by executing the following $$< command:
$$<C:\temp\test\livedebug\CDBScripts\PID-0__livedebug.cfg
Once you execute the $$< command, you will notice that the script takes over and performs the same actions as ADPlus does when run conventionally from the command line.
As a further experiment, edit the filter.config file and remove the gn commands. Now the debugger will wait for user input after executing the custom commands rather than continuing execution of the application. This could be handy if you want the opportunity to perform debugging by hand if ADPlus encounters a certain situation.
First Chance vs. Second Chance Exceptions
Throughout this post, I have been focusing on first chance exceptions for the sake of illustration. However, many times, you are only interested in the truly unhandled exceptions. In that case, you would want to capture only second chance exceptions. You certainly would want to capture first chance exceptions if you needed to capture the state at the exact point the exception was thrown and before the OS searches for any handlers. Additionally, if you suspect that the application you are debugging may be handling an exception inappropriately (maybe even blindly swallowing it), then you certainly want to catch first chance exceptions in that case.
Conclusion
In this blog post I have introduced you to ADPlus and the utility it provides when troubleshooting problems in the field. ADPlus lends itself well to capturing exceptional situations in the field since it requires no configuration changes on the affected machine thus making it an easy pill for your customers to swallow. You may also find this very useful when working with your Quality Assurance team during the development phase. For example, how many times have you encountered a situation where a problem only presents itself on a dusty old rarely-used machine in the back corner of a random QA engineer’s office? How many times, in such situations, have you felt like the only way to trouble shoot the problem effectively is to install the Visual Studio debugger and start working on that machine? Furthermore, what if the problem only happens on that dusty old machine about once a week. ADPlus can help you avoid that madness by providing an easy mechanism for capturing full process dumps on the troubled machine so you can then take those dumps to your trusty development machine for further debugging and analysis.
Have fun out there!
| Share this post : |  |
 |
 |
 |
 |
 |
 |