Remote Debugging connecting to a Remote Stub using the Microsoft Debugging Tools for Windows
The Microsoft Debugging Tools for Windows provide a couple ways to create a remote debugging connection including "Connecting to a remote session" and "Connecting to a remote stub" . Connecting to a remote session is the most commonly used of the two, and is all you typically need, but it does not allow the client to access debugging symbols missing on the remote.
Jeff’s blog post here has more information on some of the intricacies of debugging a remote session. Often a remote debugging session will be done within a corporate network where all users have access to symbol information, but if we are debugging outside of the secure environment where we cannot share symbols freely, debugging becomes more difficult .
The Microsoft debugging tools package has two server side command line applications to help us do this by connecting to a remote stub: Dbgsrv.exe for user mode debugging and Kdsrv.exe for kernel mode debugging. They provide a thin server layer for the debugger to attach with full use of local symbols and source code.
Conventional remote debug session
Let’s illustrate the benefits of using remote stubs by showing the problems encountered when connecting to a remote session.
![image_thumb[1][5]](https://msdntnarchive.blob.core.windows.net/media/TNBlogsFS/BlogFileStorage/blogs_msdn/ntdebugging/WindowsLiveWriter/RemoteDebuggingconnectingtoaRemoteStubus_BD9B/image%5B3%5D_1.png "image_thumb[1][5]")
This diagram shows the conventional remote debug session. Both the debugging host and target are running windbg, though we could use KD or CDB. The goal is to debug a buggy application called Getif.exe which runs on the debugging target. We have symbols for the application on the debugging host however for security reasons the debugging target does not have symbol access to Getif.exe. On both machines we have Windows internet symbols loaded from the https://msdl.microsoft.com/download/symbols.
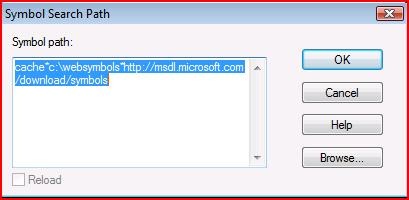
Here is the symbol path on the debugging target machine. Because this system is outside our secure environment it does not have symbol access for the Getif.exe application. This will be problematic for debugging.
Here is the symbol path on the debugging host which includes a path to the symbols for the application because it’s inside the secure location.
![clip_image010[4]_thumb[1]](https://msdntnarchive.blob.core.windows.net/media/TNBlogsFS/BlogFileStorage/blogs_msdn/ntdebugging/WindowsLiveWriter/RemoteDebuggingconnectingtoaRemoteStubus_BD9B/clip_image010%5B4%5D%5B3%5D.jpg "clip_image010[4]_thumb[1]")
To create the remote debugging server on the target machine, I specify the local port to use for the connection by using the .server command:
.server tcp:port=<localport>
![clip_image012[4]_thumb[1]](https://msdntnarchive.blob.core.windows.net/media/TNBlogsFS/BlogFileStorage/blogs_msdn/ntdebugging/WindowsLiveWriter/RemoteDebuggingconnectingtoaRemoteStubus_BD9B/clip_image012%5B4%5D%5B3%5D.jpg "clip_image012[4]_thumb[1]")
Next I select “Connect to Remote Session” on the debugging host.
![clip_image014[4]_thumb[1]](https://msdntnarchive.blob.core.windows.net/media/TNBlogsFS/BlogFileStorage/blogs_msdn/ntdebugging/WindowsLiveWriter/RemoteDebuggingconnectingtoaRemoteStubus_BD9B/clip_image014%5B4%5D%5B3%5D.jpg "clip_image014[4]_thumb[1]")
Then enter the port and server name:
![clip_image016[4]_thumb[1]](https://msdntnarchive.blob.core.windows.net/media/TNBlogsFS/BlogFileStorage/blogs_msdn/ntdebugging/WindowsLiveWriter/RemoteDebuggingconnectingtoaRemoteStubus_BD9B/clip_image016%5B4%5D%5B3%5D.jpg "clip_image016[4]_thumb[1]")
And this is where we run into the headache! Because we don’t have Getif.exe symbol access on the machine located outside of the secure environment, the stacks for getif.exe don’t display symbolic information. It makes it hard to debug the application because we can’t dump data types or view other symbolic info.
![clip_image018[4]_thumb[1]](https://msdntnarchive.blob.core.windows.net/media/TNBlogsFS/BlogFileStorage/blogs_msdn/ntdebugging/WindowsLiveWriter/RemoteDebuggingconnectingtoaRemoteStubus_BD9B/clip_image018%5B4%5D%5B3%5D.jpg "clip_image018[4]_thumb[1]")
If we want to debug Getif.exe with symbols, we need to copy the symbol files to the debug target machine and add the location to the target’s symbol path. In our scenario this may not be possible because symbols are often restricted to in-house use and not allowed to be copied freely.
Dbgsrv to the rescue!!
![image_thumb[3]](https://msdntnarchive.blob.core.windows.net/media/TNBlogsFS/BlogFileStorage/blogs_msdn/ntdebugging/WindowsLiveWriter/RemoteDebuggingconnectingtoaRemoteStubus_BD9B/image%5B7%5D.png "image_thumb[3]")
By activating Dbgsrv on the debugging target machine, the debugger on the debugging host connects with full symbol access to the user mode process on the target. The diagram above illustrates the process.
Let's run through an example using dbgsrv on the debugging target. On the debugging target enter
<path to debugging tools>\dbgsrv -t tcp:port=<localport>
Dbgsrv returns to a command prompt with no output in the command window and the debug port can be any open port on the system. It’s a good idea to confirm we are listening on the port we selected by using netstat. Here’s an example -
![clip_image020[4]_thumb[1]](https://msdntnarchive.blob.core.windows.net/media/TNBlogsFS/BlogFileStorage/blogs_msdn/ntdebugging/WindowsLiveWriter/RemoteDebuggingconnectingtoaRemoteStubus_BD9B/clip_image020%5B4%5D%5B3%5D.jpg "clip_image020[4]_thumb[1]")
Now let’s move our focus to the debugging host computer. Instead of choosing the typical “Connect a Remote Session”, we use the option, “Connect to a Remote Stub” from the File menu.
![clip_image022[4]_thumb[1]](https://msdntnarchive.blob.core.windows.net/media/TNBlogsFS/BlogFileStorage/blogs_msdn/ntdebugging/WindowsLiveWriter/RemoteDebuggingconnectingtoaRemoteStubus_BD9B/clip_image022%5B4%5D%5B3%5D.jpg "clip_image022[4]_thumb[1]")
Next enter the port and server name.
![clip_image024[4]_thumb[1]](https://msdntnarchive.blob.core.windows.net/media/TNBlogsFS/BlogFileStorage/blogs_msdn/ntdebugging/WindowsLiveWriter/RemoteDebuggingconnectingtoaRemoteStubus_BD9B/clip_image024%5B4%5D%5B3%5D.jpg "clip_image024[4]_thumb[1]")
After selecting OK, we are back to the empty Command window as expected. We won’t see any text until connected to the target process:
![clip_image026[4]_thumb[1]](https://msdntnarchive.blob.core.windows.net/media/TNBlogsFS/BlogFileStorage/blogs_msdn/ntdebugging/WindowsLiveWriter/RemoteDebuggingconnectingtoaRemoteStubus_BD9B/clip_image026%5B4%5D%5B3%5D.jpg "clip_image026[4]_thumb[1]")
Next select File-Attach to a Process option.
![clip_image028[4]_thumb[1]](https://msdntnarchive.blob.core.windows.net/media/TNBlogsFS/BlogFileStorage/blogs_msdn/ntdebugging/WindowsLiveWriter/RemoteDebuggingconnectingtoaRemoteStubus_BD9B/clip_image028%5B4%5D%5B3%5D.jpg "clip_image028[4]_thumb[1]")
It is important to note the “Attach to Process” dialog shows the list of processes running on the debugging target machine.
![clip_image030[4]_thumb[1]](https://msdntnarchive.blob.core.windows.net/media/TNBlogsFS/BlogFileStorage/blogs_msdn/ntdebugging/WindowsLiveWriter/RemoteDebuggingconnectingtoaRemoteStubus_BD9B/clip_image030%5B4%5D%5B3%5D.jpg "clip_image030[4]_thumb[1]")
Now let’s attach to the process. The title bar confirms that we connected to the process on the kdsrv target:
![clip_image032[4]_thumb[1]](https://msdntnarchive.blob.core.windows.net/media/TNBlogsFS/BlogFileStorage/blogs_msdn/ntdebugging/WindowsLiveWriter/RemoteDebuggingconnectingtoaRemoteStubus_BD9B/clip_image032%5B4%5D%5B3%5D.jpg "clip_image032[4]_thumb[1]")
Here you can see the benefit of connecting with a remote stub. The symbols for getif.exe are working for the application running on a machine located outside of the secure environment.
![clip_image034[4]_thumb[1]](https://msdntnarchive.blob.core.windows.net/media/TNBlogsFS/BlogFileStorage/blogs_msdn/ntdebugging/WindowsLiveWriter/RemoteDebuggingconnectingtoaRemoteStubus_BD9B/clip_image034%5B4%5D%5B3%5D.jpg "clip_image034[4]_thumb[1]")
But what if I need to Kernel debug?
You can do the same thing with Kernel debugging using Kdsrv.
![image_thumb[5]](https://msdntnarchive.blob.core.windows.net/media/TNBlogsFS/BlogFileStorage/blogs_msdn/ntdebugging/WindowsLiveWriter/RemoteDebuggingconnectingtoaRemoteStubus_BD9B/image%5B11%5D.png "image_thumb[5]")
If we need to attach to a kernel debugger we can use kdsrv. Much like the previous example we enter the command:
kdsrv -t tcp:port=<localport>
We can see that we are listening on the local port we selected:
![clip_image036[4]_thumb[1]](https://msdntnarchive.blob.core.windows.net/media/TNBlogsFS/BlogFileStorage/blogs_msdn/ntdebugging/WindowsLiveWriter/RemoteDebuggingconnectingtoaRemoteStubus_BD9B/clip_image036%5B4%5D%5B3%5D.jpg "clip_image036[4]_thumb[1]")
We must now start our debugger on the debugging host machine with a command line that includes the information needed to connect to the KdSrv host. As of Windbg 6.10.3.233 we cannot attach to the kdsrv remote stub from the Windbg graphical interface and then make the kernel connection to the debugging target .
![clip_image038[4]_thumb[1]](https://msdntnarchive.blob.core.windows.net/media/TNBlogsFS/BlogFileStorage/blogs_msdn/ntdebugging/WindowsLiveWriter/RemoteDebuggingconnectingtoaRemoteStubus_BD9B/clip_image038%5B4%5D%5B3%5D.jpg "clip_image038[4]_thumb[1]")
Here is the string I used in the graphic above-
windbg -k kdsrv:server=@{tcp:server=rodolpho,port=5004},trans=@{com:pipe,port=\\mimi\pipe\2008target}
Note that we are debugging to a named pipe on a kernel debug target running under Microsoft Hyper-V! This is a great way to debug without the hassle of setting up a second machine and attaching with a null modem cable.
If we wanted to attach to COM1 with a null-modem cable we would use:
windbg -k kdsrv:server=@{tcp:server=rodolpho,port=5004},trans=@{com:port=com1,baud=11500}
For more information on client and server syntax see https://msdn.microsoft.com/en-us/library/cc266440.aspx.
After Windbg starts the command window will look just like if we attached with a local debugger. The title bar will confirm that we are attaching through the debug server:
![clip_image040[4]_thumb[1]](https://msdntnarchive.blob.core.windows.net/media/TNBlogsFS/BlogFileStorage/blogs_msdn/ntdebugging/WindowsLiveWriter/RemoteDebuggingconnectingtoaRemoteStubus_BD9B/clip_image040%5B4%5D%5B3%5D.jpg "clip_image040[4]_thumb[1]")
We can also change context to the Getif.exe process after connecting to the remote stub. When we look at the application stack we have symbols for our application:
![clip_image042[4]_thumb[1]](https://msdntnarchive.blob.core.windows.net/media/TNBlogsFS/BlogFileStorage/blogs_msdn/ntdebugging/WindowsLiveWriter/RemoteDebuggingconnectingtoaRemoteStubus_BD9B/clip_image042%5B4%5D%5B3%5D.jpg "clip_image042[4]_thumb[1]")
After we have our remote stub connection, we can then share our client as a remote session, but we will always handle the symbols on the remote stub client.
Once you setup a remote stub a couple of times it’s as simple as setting up a remote session, and can make a remote debug go a lot smoother. For more information check out the debugging tools help, available outside of windbg as debugger.chm in the debugger directory, as well as https://msdn.microsoft.com/en-us/library/cc266434.aspx
Security Note: These examples use TCP/IP or named pipes and are not password protected. The debugger remotes will allow SSL and Secure pipe connections with password and certificate authentication if you require greater security. See the online help or this link for more information.