Windbg Tip: KN, .Frame , DV, and DT - It's so easy
Written by Jeff Dailey.
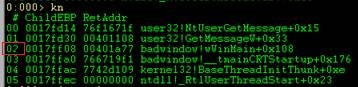
Hello NTDebuggers, many of us take for granted some of the simple commands in the debugger that make life easy. I was thinking of several in particular that go great together. The first command would be kn. Kn will show the current call stack and includes the stack frame number to the far left of the individual call.
I loaded up a copy of BadWindow.EXE in Windbg, set my thread to thread Zero via ~0s. Then I simply type kn. This dumps out the call stack, and as you can see, to the far left each call there is the stack frame number.
Using stack frame 2 from the above stack let’s look at the locals it uses. First we must get in context using .frame and the frame number.

Now to dump out the locals we can just use the dv (Display Local Variables) command. (Note you need private symbols for the binary you are debugging for this to work).
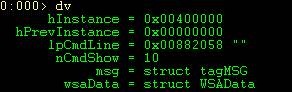
As you can see, we have several locals here. Now, because I have private symbols for this binary, the debugger already understands the structures and data types for each variable.
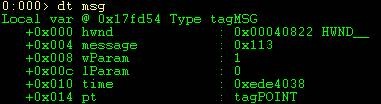
Furthermore because I’m already in the stack frames context I can simply dt (display type) with the name of the variable and the debugger figures out the address. Let’s dt msg and see what data it contains.
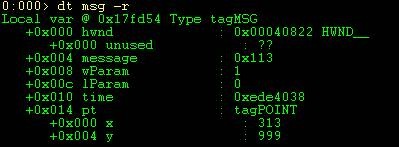
As you can see have a couple of structures that are part of this structure. Look at the right in the above output. You will notice a data type name of HWND_ and tagPOINT to the right. These are structures. The good news is that dt will work recursively and will dump out structures under your current structure. All you need to do is issue a DT –r. You can specify the depth by appending a number to –r.
For more information about the dt command and others mentioned in this blog make sure you take a look at the debugger.chm file that comes with the Windows Debugging Tools.
Good luck and happy debugging.