Debugging a bluescreen at home
Hi, my name is Chad. I work as an escalation engineer for Microsoft’s OEM support team.
A while back, I encountered an interesting crash on one of my computers at home, and I thought I’d post about how I debugged it.
This particular machine had been humming along quite happily for some time, but one day while I was scanning some photos, it bluescreened. Naturally, I hoped it was just a fluke, but after it happened a few more times while doing the same thing, I decided to debug it.
Ordinarily, if a machine crashes when performing a specific activity, like scanning photos, my first inclination would be to suspect a bug in one of the drivers involved in that activity, like the scanner driver or the USB driver. But in this case, I had been using this scanner for a long time, with the same drivers, and never had this problem, so this sudden crashing was kind of mysterious.
Let's see what we can tell from the dump!
The first order of business when looking at a crash dump is the !analyze -v command. I've trimmed some of it here for brevity, but it goes something like this:
kd> !analyze -v
*******************************************************************************
* *
* Bugcheck Analysis *
* *
*******************************************************************************
KERNEL_MODE_EXCEPTION_NOT_HANDLED (8e)
This is a very common bugcheck. Usually the exception address pinpoints
the driver/function that caused the problem. Always note this address
as well as the link date of the driver/image that contains this address.
Some common problems are exception code 0x80000003. This means a hard
coded breakpoint or assertion was hit, but this system was booted
/NODEBUG. This is not supposed to happen as developers should never have
hardcoded breakpoints in retail code, but ...
If this happens, make sure a debugger gets connected, and the
system is booted /DEBUG. This will let us see why this breakpoint is
happening.
Arguments:
Arg1: c0000005, The exception code that was not handled
Arg2: 8738e300, The address that the exception occurred at
Arg3: b9b3dc7c, Trap Frame
Arg4: 00000000
Debugging Details:
------------------
EXCEPTION_CODE: (NTSTATUS) 0xc0000005 - The instruction at "0x%08lx" referenced memory at "0x%08lx". The memory could not be "%s".
FAULTING_IP:
+ffffffff8738e300
8738e300 0000 add [eax],al
TRAP_FRAME: b9b3dc7c -- (.trap ffffffffb9b3dc7c)
ErrCode = 00000002
eax=00000001 ebx=bc514c68 ecx=0001065e edx=bc510000 esi=00000955 edi=b9b3dd64
eip=8738e300 esp=b9b3dcf0 ebp=b9b3dd08 iopl=0 nv up ei pl zr na po nc
cs=0008 ss=0010 ds=0023 es=0023 fs=0030 gs=0000 efl=00010246
8738e300 0000 add [eax],al ds:0023:00000001=??
Resetting default scope
DEFAULT_BUCKET_ID: DRIVER_FAULT
BUGCHECK_STR: 0x8E
LAST_CONTROL_TRANSFER: from 8051d6a7 to 8053331e
STACK_TEXT:
WARNING: Frame IP not in any known module. Following frames may be wrong.
b9b3dcec bf801619 b9b3dd64 0012eee4 bf81551f 0x8738e300
b9b3dd08 bf81553c b9b3dd64 0012eee4 bf81551f win32k!ValidateHwnd+0x5c
b9b3dd50 804de7ec 0001065e 012eb244 00000000 win32k!NtUserInvalidateRect+0x1d
b9b3dd50 7c90eb94 0001065e 012eb244 00000000 nt!KiFastCallEntry+0xf8
0012eecc 77d4b601 0105a943 0001065e 012eb244 ntdll!KiFastSystemCallRet
0012eed0 0105a943 0001065e 012eb244 00000000 USER32!NtUserInvalidateRect+0xc
77d4b601 90909090 001134b8 0300ba00 12ff7ffe NikonScan4!GetSource+0x21e93
...
From the stack trace, we can tell that NikonScan4.dll made a call into User32, which ultimately ended up calling into win32k.sys down in kernel mode. Win32k was in a function called ValidateHwnd() and then tried to call some function at address 0x8738e300, at which point we tried to dereference an invalid pointer and crashed.
What’s at 0x8738e300?
kd> dc 8738e300
8738e300 00000000 00000001 00000000 87360350 ............P.6.
8738e310 00000000 00000001 f71af9fe f71b0030 ............0...
8738e320 f71afb0e f71afbb4 f71b0098 f71b0214 ................
8738e330 f71afef6 f71aff8e 07fef800 00000000 ................
8738e340 f71afffc 00000000 0a0e000a 644c6d4d ............MmLd
8738e350 8732ea58 870303e0 ffffffff ffffffff X.2.............
8738e360 00000012 00000000 f797f000 f7989905 ................
8738e370 0000c000 00500050 e1971458 00160016 ....P.P.X.......
kd> !pool 8738e300 2
Pool page 8738e300 region is Nonpaged pool
*8738e2f8 size: 50 previous size: 8 (Allocated) *NV
Owning component : Unknown (update pooltag.txt)
Well, that’s bad. 0x8738e300 isn’t actually a valid address of a function. That location contains some user data (specifically, some nonpaged pool).
So, that's why we blew up: the ValidateHwnd() function in win32k made a call to this bad address which contains data instead of code! Let's see if we can figure out why it did this. We can find the return address in win32k!ValidateHwnd on the stack, and unassemble the instructions leading up to the point where we ran off into the weeds.
kd> kv L8
ChildEBP RetAddr Args to Child
WARNING: Frame IP not in any known module. Following frames may be wrong.
b9b3dcec bf801619 b9b3dd64 0012eee4 bf81551f 0x8738e300
b9b3dd08 bf81553c b9b3dd64 0012eee4 bf81551f win32k!ValidateHwnd+0x5c (FPO: [Non-Fpo])
b9b3dd50 804de7ec 0001065e 012eb244 00000000 win32k!NtUserInvalidateRect+0x1d (FPO: [Non-Fpo])
b9b3dd50 7c90eb94 0001065e 012eb244 00000000 nt!KiFastCallEntry+0xf8 (FPO: [0,0] TrapFrame @ b9b3dd64)
0012eecc 77d4b601 0105a943 0001065e 012eb244 ntdll!KiFastSystemCallRet (FPO: [0,0,0])
0012eed0 0105a943 0001065e 012eb244 00000000 USER32!NtUserInvalidateRect+0xc
77d4b601 90909090 001134b8 0300ba00 12ff7ffe NikonScan4!GetSource+0x21e93
77d4b605 001134b8 0300ba00 12ff7ffe 900008c2 0x90909090
The return address from where we made the bad call is bf801619. Let’s unassemble a few instructions backwards from that address (using the handy but often-overlooked “ub” command) and see what the code was doing:
kd> ub bf801619
win32k!ValidateHwnd+0x2f:
bf8015ff 8d1c82 lea ebx,[edx+eax*4]
bf801602 8bc1 mov eax,ecx
bf801604 c1e810 shr eax,0x10
bf801607 663b430a cmp ax,[ebx+0xa]
bf80160b 75ad jnz win32k!ValidateHwnd+0x3d (bf8015ba)
bf80160d 807b0801 cmp byte ptr [ebx+0x8],0x1
bf801611 7573 jnz win32k!ValidateHwnd+0xff (bf801686)
bf801613 ff15e0b298bf call dword ptr [win32k!_imp__PsGetCurrentThread (bf98b2e0)]
OK, so it's pretty simple. Win32k decided which function address to call by reading it from a pointer stored at a hardcoded location (in other words, in a global variable) within Win32k itself. That pointer is located at bf98b2e0. The debugger helpfully tells us that this pointer is intended to contain the address of a function called PsGetCurrentThread, but let’s double-check this and make sure it actually does. At this point, the working assumption would be that this pointer had gotten corrupted somehow.
kd> dd bf98b2e0 L1
bf98b2e0 804e4a15
Interesting. bf98b2e0 contains the value 804e4a15. This is not even close to the bad address the processor actually called! Remember, from the stack trace, we jumped to 8738e300 instead. What does this pointer actually point to?
kd> ln 804e4a15
(804e4a15) nt!PsGetCurrentThread | (804e4a51) nt!KeSetEventBoostPriority
Exact matches:
nt!PsGetCurrentThread = <no type information>
Sure enough, 804e4a15 is the address of nt!PsGetCurrentThread.
So, basically, win32k was trying to call PsGetCurrentThread(), and even had the correct pointer in memory to get there, but the processor instead jumped to a bogus address located in the middle of some user data.
At this point it's pretty safe to say that this is a hardware problem, and furthermore, since the relevant memory looks fine, it looks like a problem within the CPU itself. (I’m not an expert on CPU architecture, but if I were to take a wild guess I’d say that maybe the processor had some problem when reading from its L2 cache.)
Upon discovering this, I decided to crack open my case and take a look. It didn’t take long to spot the problem:
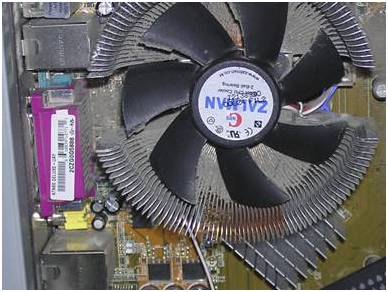
Yes, that's my CPU fan. Notice that the heatsink is completely clogged up with dust!
The resolution to this story: I took a can of compressed air and blew all the dust out of the heatsink. This took care of the problem, and the computer happily scanned hundreds of photos and hasn’t crashed again since. Why was it only crashing when I was scanning photos? Most likely because this was causing the CPU to run at 100% utilization for extended periods of time, and it was simply overheating!