JS: Improve performance when starting IE using Visual Studio
- When developing web sites in VS, I always start IE by pressing F5 or by right-clicking on the HTML page and clicking on "View in Browser".
- Recently, I was experimenting with HTML5 code to copy the frames of an MP4 video, reverse the frame data and render it back on a canvas.
- The code uses requestAnimationFrame to process the frames and also displays the achieved frames per second (fps).
- This is what I got:
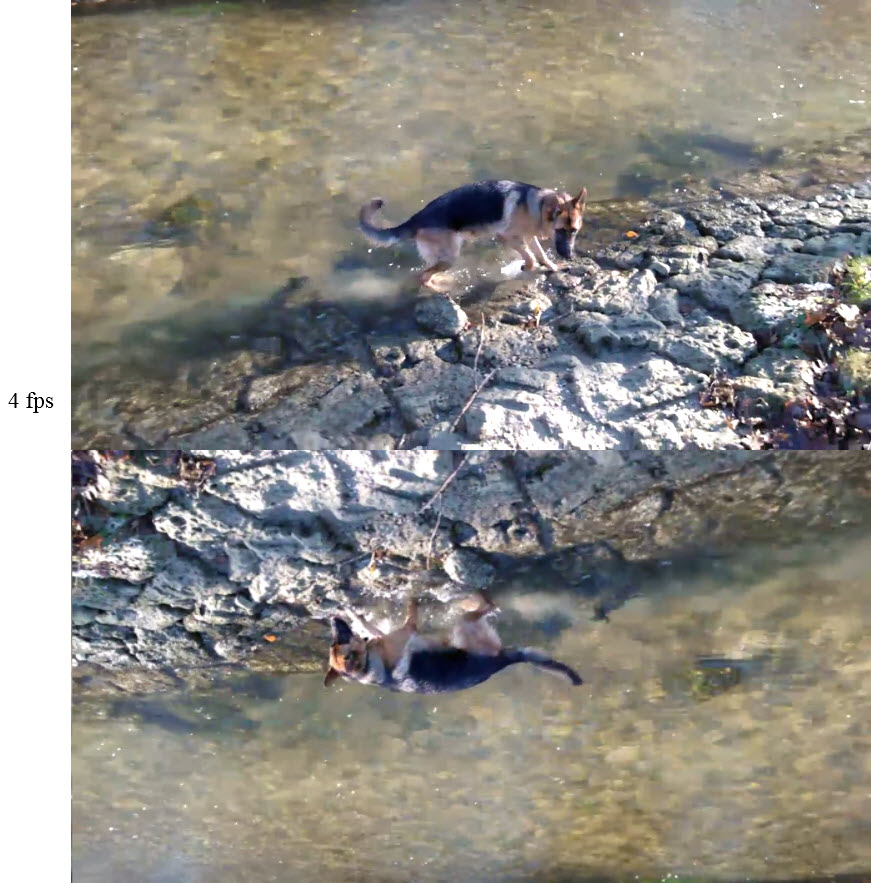
- Only 4 fps. To analyze the cause, I used xperf as follows:
- Open a CMD window with admin rights.
- Set environment variables:
- set _NT_SYMBOL_PATH=SRV*C:\websymbols*https://msdl.microsoft.com/downloads/symbols
- set _NT_SYMCACHE_PATH=C:\websymbols
- Open the web site using IE.
- Run:
- xperf -on base
- ... profiling occurs here, let it run for a few seconds ...
- xperf -d trace.etl
- ... trace file gets saved ...
- Open the trace file in the viewer:
- xperf trace.etl
- In the viewer:
- Click on "Trace --> Load Symbols"
- Open frame: "CPU Sampling by Process --> iexplorer.exe (Thread ID that shows high CPU usage)"
- Select graph area with high CPU usage, then right-click on it and click on "Summary Table"
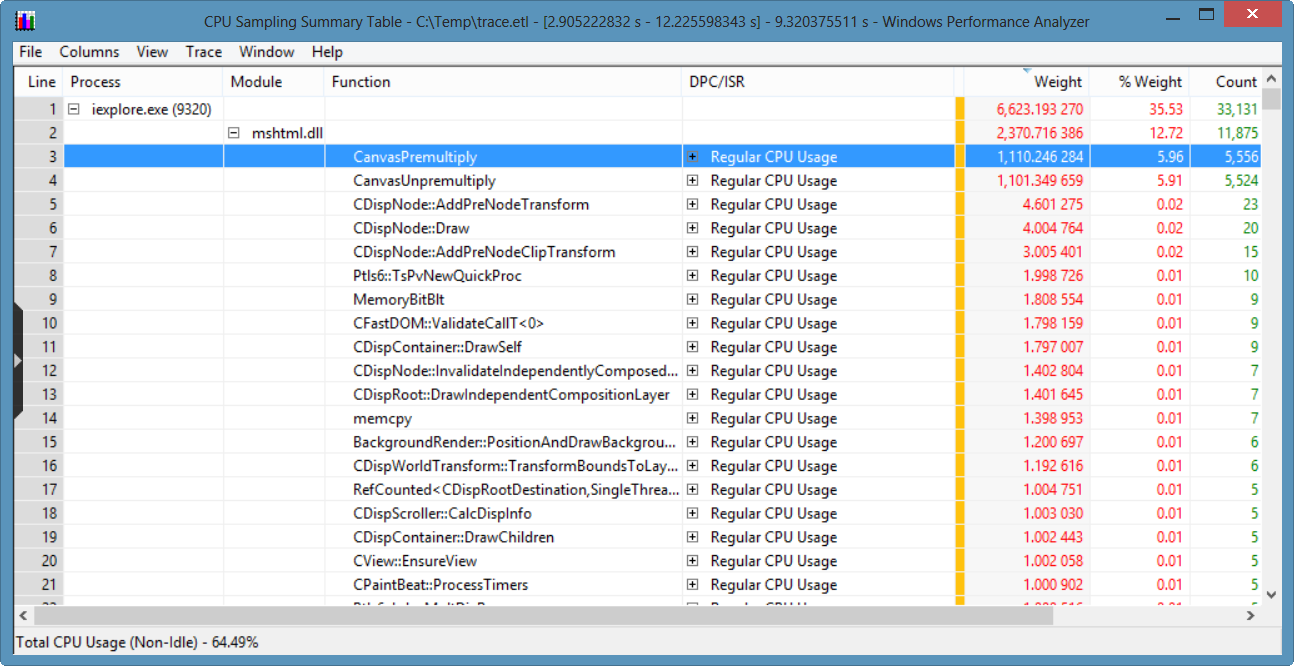
- Wait for symbols to load and window to appear:
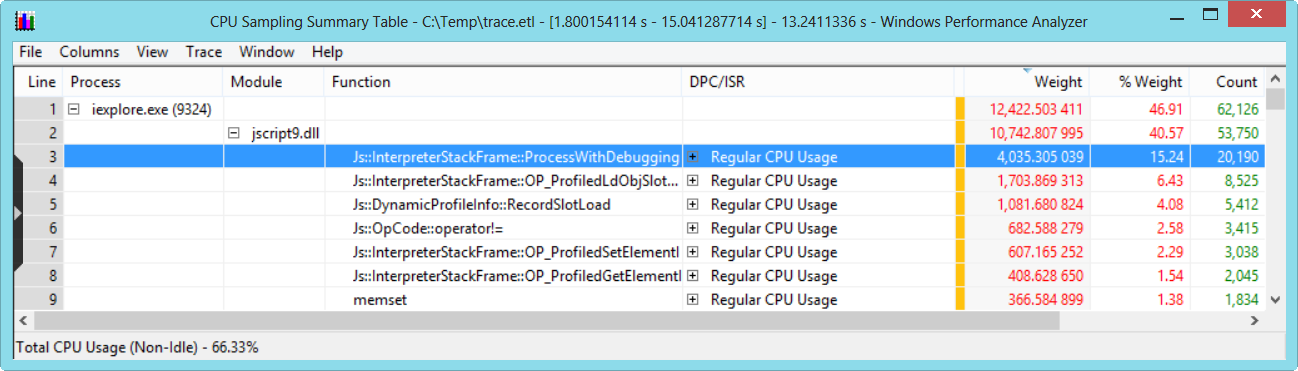
- Sort the table by clicking on the Weight column.
- The screen shot shows that 40.57% of the CPU capacity was spent in the jscript9.dll (Chakra, IE's JS engine) and 15.24% making function calls to "Js::InterpreterStackFrame::ProcessWithDebugging".
- "ProcessWithDebugging" indicates that debugging is taking place, thus adding an overhead to the execution.
- To test the JS code in IE in "release mode", you cannot set the VS build to "Release" as it will make no difference for the client code.
- Instead, keep the IE window open and just pause the JS execution, e.g. by pressing some button that you can add or pausing the video.
- Then open a fresh instance of IE: On Windows 7 or 8, right-click on the IE icon and then click on the Internet Explorer icon on the context menu.
- Copy the URL of the first IE window to the fresh window and see what happens:
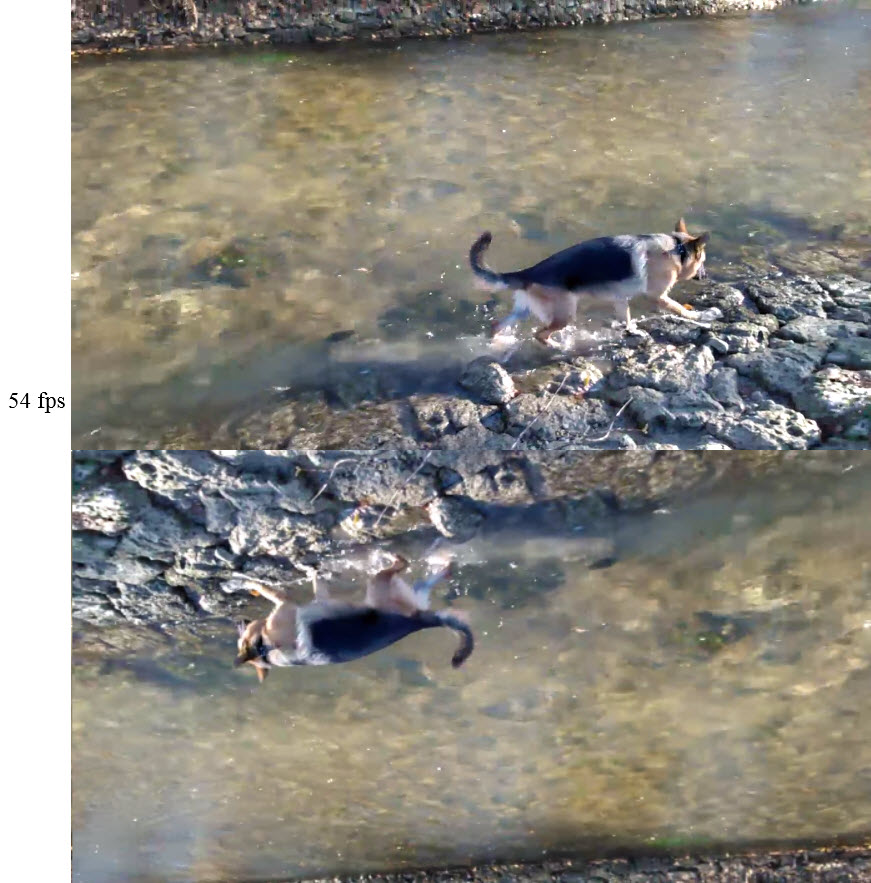
- Now the code reaches 54 fps (of 60 fps max.)!
- Taking a look at the trace of this fresh window shows that the JS execution time is now almost insignificant:
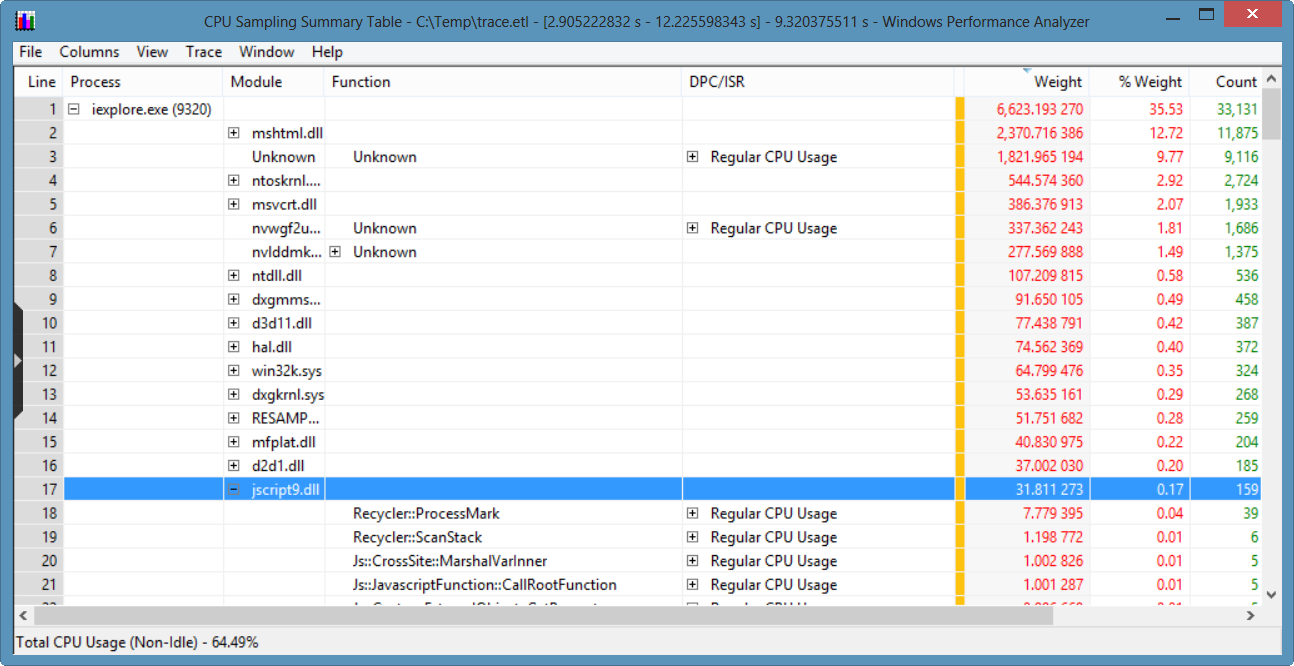
- Instead, most of the time is now being spent in the canvas doing matrix operations:
- Comparison of performance difference of the code in my article "JS: Dots are bad, M'kay?":
IE started from VS
array.length: 5881
len: 4678
Math.floor: 6537
| 0: 4566
document not cached: 6452
document cached: 2831
Fresh IE started outside of VS
array.length: 786
len: 664
Math.floor: 869
| 0: 714
document not cached: 3729
document cached: 44
Summary: When doing something that needs JS performance, start a fresh IE and your code may run up to 100 times faster!