An Interesting case of LSASS process spiking every hour on a Forefront Threat Management Gateway(TMG) Server
Recently I worked on a very interesting issue which I thought I would share with you. TMG server stopped responding to all the requests every hour and after a few seconds it will recover from that state on its own.
And during this period we noticed that only the LSASS process was Spiking. So, as it looked to be a Performance issue we gathered the Perfmon logs on the TMG server. We started Perfmon and kept it running till and beyond the time of the issue.
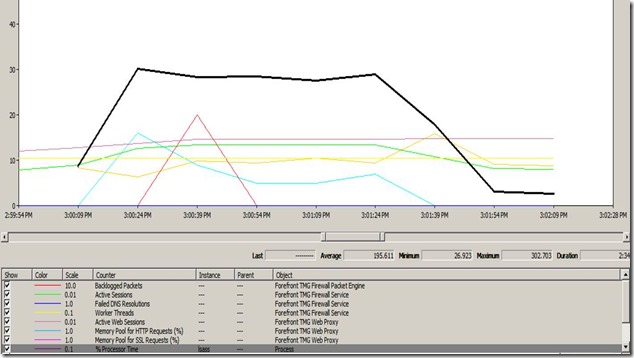
When we started looking into the Perfmon logs and when we Zoomed In to the Time when the Spike happened we could see this:
As we can see above, there is a huge Spike in the LSASS process at the time of the issue. Now lets look at some of the other Counters to make more sense out of it. Lets have a look at the “Process Queue Length” Counter:
Process Queue Length also Spiked to 16 at that time, which shows that the Processors were under high load at that time. We had 4 Procs on this server and a good “Process Queue Length” values would be 2 per Processor. So, here an acceptable value would have been 8. But it has actually touched 16 which is really alarming and shows that the Processors were really Busy doing a lot of work at that particular time.
Now, lets have a look at one of the TMG related counters of that time:
As we can clearly see above the number of Active Sessions on TMG are jumping high during this time. There were around 700 sessions before that time and suddenly at that time we see the sessions going to 1400. Which means that there are around 500-600 sessions coming on TMG at the same time.
Now we need to see what type of sessions are coming on TMG at that time. So, we took the help of our TMG logs which we also collected during the same time.
And when we looked into the logs(which are in a csv format and can be opened in Excel), we were finding it difficult to find out number of hits on one particular Rule during that time, which would have actually given us a hint. So, we took help of Pivots in Microsoft Excel to find that out. And here is what we got from there:
As we can see above, how beautifully this Pivot Table has shown us the Rules which have the Highest number of hits during that time. And these rules were the Web Publishing rules listening on Port 443 and 80 as well. Now it started making more sense.
And when we investigated that further, there were some scheduled jobs running Hourly which were sending this traffic from the external clients to these Published servers.
Now if we join all these Dots we can see that there are lot of sessions coming at the same time every hour and because of that LSASS has to work on the Encryption and Decryption part of that traffic. Processing a lot of Encryption/Decryption at the same time was putting high load on the LSASS process and hence we were seeing that Spike.
I would like to Specially Thank my colleague Ming Chen(from Active Directory Team) for helping us in Narrowing down this issue, and coming up with this Innovative idea of using Pivots to get the Rules with Highest hits from the Web Proxy Logs of TMG.
I am sure this will be a good learning for all us as it was for me.
AUTHOR
NITIN SINGH
SUPPORT ESCALATION ENGINEER, FOREFRONT EDGE SECURITY, MICROSOFT

![clip_image002[10] clip_image002[10]](https://msdntnarchive.blob.core.windows.net/media/MSDNBlogsFS/prod.evol.blogs.msdn.com/CommunityServer.Blogs.Components.WeblogFiles/00/00/01/34/68/metablogapi/2543.clip_image00210_thumb_2824BB1B.jpg)
![clip_image002[12] clip_image002[12]](https://msdntnarchive.blob.core.windows.net/media/MSDNBlogsFS/prod.evol.blogs.msdn.com/CommunityServer.Blogs.Components.WeblogFiles/00/00/01/34/68/metablogapi/7245.clip_image00212_thumb_6F4A614D.jpg)
![clip_image002[16] clip_image002[16]](https://msdntnarchive.blob.core.windows.net/media/MSDNBlogsFS/prod.evol.blogs.msdn.com/CommunityServer.Blogs.Components.WeblogFiles/00/00/01/34/68/metablogapi/4621.clip_image00216_thumb_776C2B70.jpg)