Debugging TouchDevelop scripts
You might already know that you can try out upcoming features of the mobile application development environment TouchDevelop by going to touchdevelop.com/app/beta which runs the beta version of the TouchDevelop Web App in your browser.
We often get asked what the new features in the beta version are. Right now, we have a really useful new experience lined up in the latest beta 44996: Debugging. You have to try out the new debugging experience to see yourself how easy it can be to debug your scripts on your mobile device!
This new feature will become available in the regular TouchDevelop experience later once we have received positive feedback from our beta testers. Everyone is invited to beta test now by going to:
Like TouchDevelop on Facebook to stay up to date.
Update (July 15th): The new debugging experience is now part of the regular TouchDevelop experience on all platforms, except the TouchDevelop app 2.11 for Windows Phone 7. You might have to refresh the page or clear your caches to get the latest experience.
running in debug mode
 Once you enter the TouchDevelop script editor, you will see a new big debug button next to the familiar run button.
We carefully designed the icon of the new button so that you won’t feel like pressing it unless you really want to debug your script. Scripts running in debug mode run slower than normally.
stepping through your code
Once you start your script in debugging mode via the debug button, you will see an array of new buttons.
You can continue, step in, step over, and step out of the individual statements in your code – just like you might already know it from other debuggers. You can also choose to exit the debugger and terminate the run.
 You can set a breakpoint at any statement either while editing code, or while debugging. Just tap on a statement and then tap the big red breakpoint button. Tap the button again to remove the breakpoint. Breakpoints are not permanently stored; they may disappear when you leave the editor or debugger.

 While your script is running in debugging mode, the back button on the wall takes you back into the code view while the script is still running. You can also pause the script by tapping on the pause button on the wall.
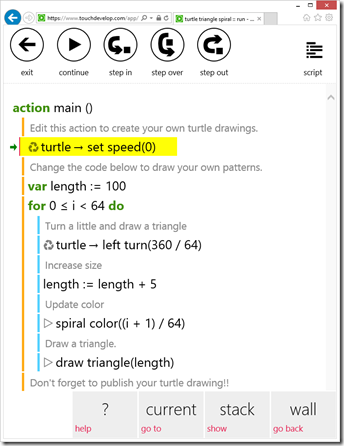
 On the right you can see an ongoing debugging session for the showcase turtle script.
At the top are the continue and stepping buttons that allow you to run your code in a controlled fashion, and at the bottom are a few buttons that help you navigate during your debugging session: current takes you back to the next statement to be executed, you can show all active actions on the stack, and you can switch back to the wall view.
While you step through your code, you will see that all the statements that already got executed get colored in blue. What you are seeing is another feature of the debugger: a built-in code coverage view.
You can tap the exit button if you want to stop debugging.
I took the screenshot on a PC, but all debugging features work just as well on your mobile device!
viewing values
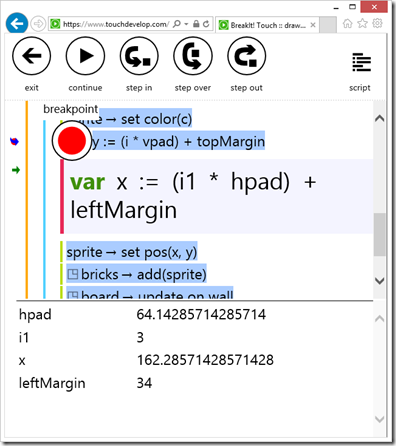
 When you tap on a statement while debugging, you get a panel at the bottom showing you the values of relevant data and local variables --- that is all data and local variables mentioned in the selected statement.
If a value is a compound value, then you might get more information when you tap on it.
You can tap on any visible statement to view different parts of the script’s data and local variables. Changing the statement selection for viewing values is independent of stepping through the statements in your code.
Viewing of values is not only available when you started a debugging session via the debug button in the code editor, but also when a script crashes.
debugging and posting crashes
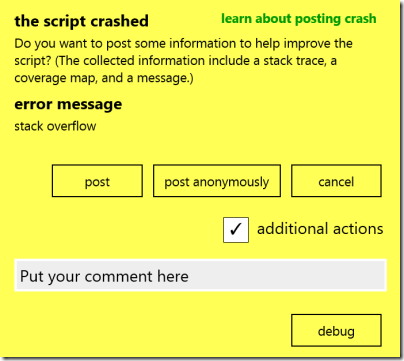
When a script crashes, you now get a dialog with many more options; some only become visible after you check the additional actions box.
You get a number of options in this dialog: You can post crash information consisting of a stack trace, coverage information, and the error message shown in the dialog; you can post this information and associate it with your user account, which is similar to how you would post a comment. Alternatively, you can post anonymously which is still going to be helpful to debug the script, but doesn’t identify you. You can also simply cancel.
You can also help by writing a comment on how you triggered the crash; this comment gets posted under your user account, just like all other comments. If this is your script, or you feel like debugging someone else’s script, then you can inspect the crashed program state by tapping on debug. You cannot continue executing the script, as it has crashed. But you can inspect the stack trace, the coverage data, and the values.
script insights
We have rearranged the tabs in the script properties that you see when you browse a published script in the script bazaar.
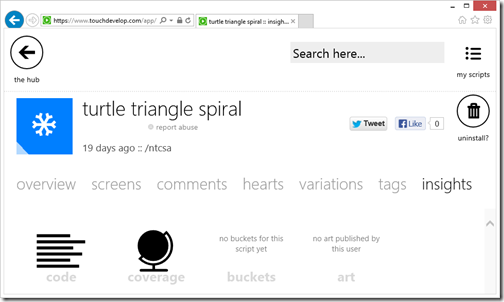
 There is now a new insights tab on the right. Insights aggregate code and art, and also features two new concepts: crowd coverage and crash buckets.
If someone runs a published script, and the script eventually stops (without crashing), then anonymous code coverage information may be uploaded to the cloud. You can view the aggregated anonymous code coverage information via the crowd coverage icon in the insights tab. The collection of anonymous code coverage only starts with beta 44996, and the anonymous collection is not exhaustive but stochastic. So you won't find too many scripts with crowd coverage data yet.
If someone runs a published script and the script crashes, the user may post crash information (via the yellow dialog described above). The cloud sorts all posted crashes into buckets (depending on how similar to stack traces are), and you can view the posted data via the buckets icon in the insights tab. The ability to post crashes only starts with beta 44996, so you won't find too many buckets yet.
documentation
We are still improving the official documentation, and we are looking for your feedback.
- documentation on debugging
- documentation on crash posting
bugs
We are still working on the interactions between pages, boxes and debugging. Please send any other bugs you find to touchdevelop@microsoft.com.
acknowledgements
The debugging feature is the result of the still ongoing internship of Mikhail Beliaev who is currently visiting us from Saint-Petersburg, Russia.
This is not the first graphical debugger that runs directly on a mobile device, we experimented with other platforms earlier.
stay in touch
If you want to stay up-to-date, like TouchDevelop on Facebook.

