SCOM 2012 - Empty Reports?
Updated 06 July 2015
A few years ago I hit an issue with my logical disk reports being empty...and this week so did a client of mine. The data is coming in, everything looks healthy, so what could it be? As the data comes into the data warehouse (DW) it's in a RAW state, but reports are run against aggregated data (hourly, daily). If that data isn't being aggregated, then your reports will be empty. In both cases I've investigated, aggregation (via StandardDataSetMaintenance) is running....it's just behind.
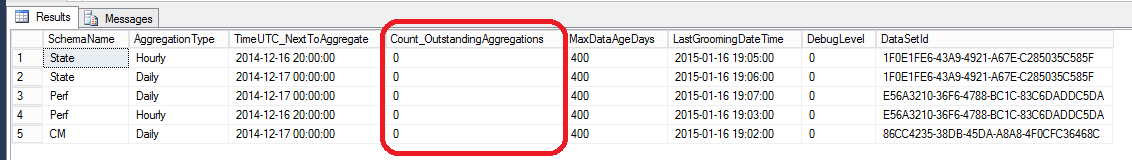
How is your DW is doing? Try running this query on your DW:
Use OperationsManagerDW;
With AggregationInfo As (Select AggregationType = Case
When AggregationTypeId = 0 Then 'Raw'
When AggregationTypeId = 20 Then 'Hourly'
When AggregationTypeId = 30 Then 'Daily'
Else NULL
End
,AggregationTypeId
,MIN(AggregationDateTime) As 'TimeUTC_NextToAggregate'
,SUM(Cast (DirtyInd As Int)) As 'Count_OutstandingAggregations'
,DatasetId
From StandardDatasetAggregationHistory
Where LastAggregationDurationSeconds Is Not NULL
Group By DatasetId, AggregationTypeId)
Select
SDS.SchemaName
,AI.AggregationType
,AI.TimeUTC_NextToAggregate
,Count_OutstandingAggregations
,SDA.MaxDataAgeDays
,SDA.LastGroomingDateTime
,SDS.DebugLevel
,AI.DataSetId
From StandardDataSet As SDS WITH(NOLOCK)
Join AggregationInfo As AI WITH(NOLOCK) On SDS.DatasetId = AI.DatasetId
Join dbo.StandardDatasetAggregation As SDA WITH(NOLOCK) On SDA.DatasetId = SDS.DatasetId And SDA.AggregationTypeID = AI.AggregationTypeID
Order By SchemaName Desc
Hopefully, you don't have more than 1-2 outstanding aggregations. However, if the number is higher than that keep reading....
For each schema that has >3 outstanding aggregations, run this:
Note: Example is for perf schema.
Note: Running will aggregate hourly and daily data for that schema.
Declare @i int
Set @i=0
Declare @DataSet uniqueidentifier
Set @DataSet = (Select DataSetId From StandardDataset Where SchemaName = 'Perf')
While(@i<=500)
Begin
Exec StandardDataSetMaintenance @DataSet
Set @i=@i+1
Waitfor Delay '00:00:05'
End
*The "While(@I<=500)" determines how many times to loop. You can alter 500 to meet your needs.
This will get you back to a healthy state, but doesn't guarantee you'll stay current. If this is a chronic issue for you, consider tuning your MPs to limit unnecessary writes to the DW. Do you really record/store logical disk size multiple times a day? As always, tuning generally is the key to keeping OpsMgr happy and healthy!
Update: 23 January 2015
If your database is chronically behind, try looking at how much data you receive a day...and how much the default grooming will handle.
1) Run this on the OpsDB to see how many events you get a day
SELECT CASE
WHEN(GROUPING(CONVERT(VARCHAR(20), TimeAdded,102)) = 1)
THEN 'All Days'
ELSE CONVERT(VARCHAR(20), TimeAdded,
102) END AS DayAdded,
COUNT(*) AS EventsPerDay
FROM EventAllView
GROUP BY CONVERT(VARCHAR(20), TimeAdded,
102) WITH ROLLUP
ORDER BY DayAdded DESC
2) Run this on the DW and note the "MaxRowstoGroom" number.
Select * from StandardDatasetAggregation Where GroomStoredProcedureName = 'StateGroom'
3) If "MaxRowstoGroom" isn't bigger than the average number of events received daily, increase it. For example, set the MaxRowsToGroom to 150000:
Update StandardDatasetAggregation
Set MaxRowsToGroom = 150000
Where GroomStoredProcedureName = 'StateGroom'
Do the same for alert data:
1) Number of console Alerts per Day (OpsDB):
SELECT CONVERT(VARCHAR(20), TimeAdded,102) AS DayAdded, COUNT(*) AS NumAlertsPerDay
FROM Alert WITH (NOLOCK)
WHERE TimeRaised is not NULL
GROUP BY CONVERT(VARCHAR(20), TimeAdded,102)
ORDER BY DayAdded DESC
2) Run this on the DW and note the "MaxRowstoGroom" number.
Select * from StandardDatasetAggregation Where GroomStoredProcedureName = 'AlertGroom'
3) Increase MaxRowstoGroom if needed
Do the same for perf data:
1) Performance insertions per day (OpsDB):
SELECT CASE WHEN(GROUPING(CONVERT(VARCHAR(20), TimeSampled, 102)) = 1)
THEN 'All Days' ELSE CONVERT(VARCHAR(20), TimeSampled, 102)
END AS DaySampled,COUNT(*) AS PerfInsertPerDay
FROM PerformanceDataAllView with (NOLOCK)
GROUP BY CONVERT(VARCHAR(20),TimeSampled, 102) WITH ROLLUP
ORDER BY DaySampled DESC
2) Run this on the DW and note the "MaxRowstoGroom" number.
Select * from StandardDatasetAggregation Where GroomStoredProcedureName = 'PerformanceGroom'
3) Increase MaxRowstoGroom if needed
Update: 06 July 2015
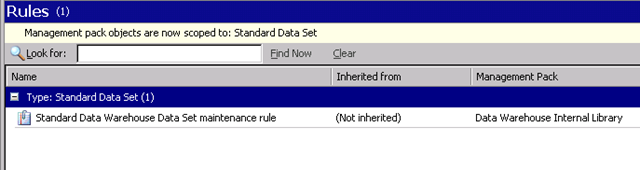
If you are hugely behind (50+ rows) you could see a conflict with the automatic job running at the same time as your manual one. Try disabling this rule until you stop the manual grooming…. This stored procedure is called on the data warehouse every 60 seconds. It performs many, many tasks, of which Index optimization is but one.
Good luck! Nicole
For more guidance, see https://support.microsoft.com/kb/2573329