[Service Fabric] Auto-scaling your Service Fabric cluster–Part II
In Part I of this article, I demonstrated how to set up auto-scaling on the Service Fabric clusters scale set based on a metric that is part of a VM scale set (Percentage CPU). This setting doesn't have much to do at all with the applications that are running in your cluster, it's just a pure hardware scaling that may take place because of your services CPU consumption or some other thing consuming CPU.
There was a recent addition to the auto-scaling capability of a Service Fabric cluster that allows you to use an Application Insights metric, reported by your service to control the cluster scaling. This capability gives you more finite control over not just auto-scaling, but which metric in which service to provide the metric values.
Creating the Application Insights (AI) resource
Using the Azure portal, the cluster resource group appears to have a few strange issues in how you create your AI resource. To make sure you build the resource correctly, follow these steps.
1. Click on the name of the resource group where your cluster is located.
2. Click on the +Add menu item at the top of the resource group blade.
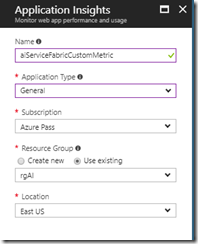
3. Choose to create a new AI resource. In my case, I created a resource that used a General application type and used a different resource group that I keep all my AI resources in.
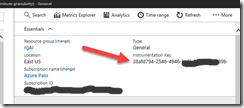
4. Once the AI resource has been created, you will need to retrieve and copy the Instrumentation Key. To do this, click on the name of your newly created AI resource and expand the Essentials menu item, you should see your instrumentation key here:
You'll need the instrumentation key for your Service Fabric application, so either paste it in to Notepad or somewhere where you can access it easily.
Modify your Service Fabric application for Application Insights
In Part I of this article, I was using a simple stateless service app https://github.com/larrywa/blogpostings/tree/master/SimpleStateless and inside of this code, I had commented out code for use in this blog post.
I left my old AI instrumentation key in-place so you can see where to place yours.
1. If you already have the solution from the previous article (or download it if you don't), the solution already has the NuGet package for Microsoft.ApplicationInsights.AspNetCore added. If you are using a different project, add this NuGet package to your own service.
2. Open appsettings.json and you will see down at the bottom of the file where I have added my instrumentation key. Pay careful attention to where you put this information in this file, brackets, colons etc can really get you messed up here.
3. In the WebAPI.cs file, there are a couple of things to note:
a. The addition of the 'using Microsoft.ApplicationInsights;' statement.
b. Line 31 - Uncomment the line of code for our counter.
c. Line 34 - Uncomment the line of code that create a new TelemetryClient.
d. Lines 43 - 59 - Uncomment out the code that creates the custom metric named 'CountNumServices'. Using myClient.TrackMetric, I can create any custom metric of any name that I wish. In this example, I am counting up to 1200 (20 minutes of time) and then I count down from there to 300, 1 second at a time. Here, I am trying to provide ample time for the cluster to react appropriately for the scale-out and scale-in.
4. Rebuild the solution.
5. Deploy your solution to the cluster.
Here is a catchy situation. To actually be able to setup your VM scale set to scale based on an AI custom metric, you have to deploy the code to start generating some of the custom metric data, otherwise it won't show up as a selection. But, if you currently have a scaling rule set, as in Part I, the nodes may still be reacting to those rules and not your new rules. That's ok, we will change that once the app is deployed and running in the cluster. And, you need to let the app run for about 10 minutes to start generating some of these metrics.
Confirming custom metric data in Application Insights
Before considering testing out our new custom metric, you need to make sure the data is being generated.
1. Open your AI resource that you recently created. The key was placed in the appsettings.json file.
2. Make sure you are on the Overview blade, then select the Metrics Explorer menu item.
3. On either of the charts, click on the very small Edit link at the upper right-hand corner of the chart.
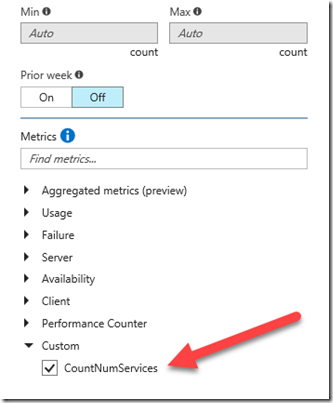
4. In the Chart details blade, down toward the bottom, you should see a new 'Custom' section. Select CountNumServices.
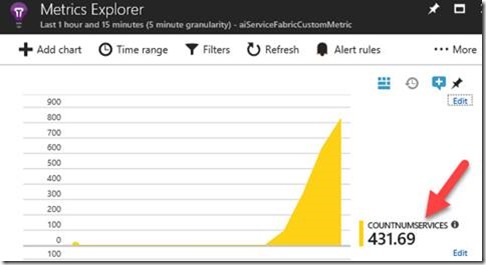
5. Close the Chart details blade. It is handy to have this details chart so you can see what the current count it to predict whether the cluster should be scaling out or in.
Modifying your auto-scaling rule set
1. Make sure you are on the Scaling blade for your VM scale set.
2. In the current rule set, either click on the current Scale out rule, Scale based on a metric or click on the +Add rule link.
3. In my case, I clicked on Scale based on a metric, so we'll go with that option. Select +Add a rule.
4. Here is the rule I created:
a. Metric source: Application Insights
b. Resource type: Application Insights
c. Resource: aiServiceFabricCustomMeric ~ this is my recently created AI resource
d. Time aggregation: Average
e. Metric name: CountNumServices ~ remember, if you don't see it when you try to scroll and find the metric to pick from, you may not have waited long enough for data to appear.
f. Time grain: 1 minute
g. Time grain statistic: Average
h. Operator: Greater than
i. Threshold: 600
j. Duration: 5 minutes
k. Operation: Increase count by
l. Instance count: 2
m. Cool down: 1 minute
Basically, after the count reaches 600, increase by two nodes. Wait 1 minute before scaling up any more nodes (note, in real production, this number should be at least 5 minutes). Actually, the number will be greater than 600 because we are using Average as the time aggregation and statistic.
5. In the Scale rule options blade
6. Select the Add button.
7. To create a scale in rule, I followed the same process but with slightly different settings:
a. Metric source: Application Insights
b. Resource type: Application Insights
c. Resource: aiServiceFabricCustomMeric ~ this is my recently created AI resource
d. Time aggregation: Average
e. Metric name: CountNumServices ~ remember, if you don't see it when you try to scroll and find the metric to pick from, you may not have waited long enough for data to appear.
f. Time grain: 1 minute
g. Time grain statistic: Average
h. Operator: Less than
i. Threshold: 500
j. Duration: 5 minutes
k. Operation: Decrease count by
l. Instance count: 1
m. Cool down: 1 minute
Notice that while decreasing, I am decreasing at a lesser rate than when increasing. This is to just make sure we don't make any dramatic changes that could upset performance.
8. Save the new rule set.
9. If you need to add or change who gets notified for any scale action, go to the Notify tab, make your change and save it.
10. At this point, you could wait for an email confirmation of a scale action or go in to the Azure portal AI resource and view the metrics values grow. Remember though, what you see in the chart are 'averages', not a pure count of the number of incremented counts. Also, when scaling, it uses averages.
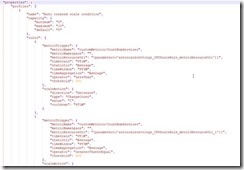
In case you are curious what these rules would look like in an ARM template, it looks something like this:
I'll provide the same warning here that I did in Part I. Attempting to scale out or in in any rapid fashion will cause instability in your cluster. When scaling out, you may consider to increase the number of nodes that are added at one time to keep you from having to wait so long for performance improvements (if that is what you are going for).
