Dynamics NAV Performance Tooling Part 2: Ghostbusters
After patrolling some of the installations out there, our Ghostbusters team has decided it is about the time to bust the myth of a few ghosts out there, and the first on the list is our SmartSQL Bogeyman.
If you have an installation with larger data volume in some areas/tables, then chances are that you might have experienced slower response on one or two of your list- or card type pages. Typically, upon observing this, the savvy engineer will fire up the sql trace to peep behind the scene and there he or she might spot a massive query with higher reads, and sometimes long duration. We call this the SmartSQL query. It is at this point that things become more fuzzy. Complex query, vast query plans and after all - this all used to work well before. Enter Bogeyman.
It is easy and tempting to believe that the problem is in these SmartSQL queries, or as popular myth goes 'flowfields on pages'. These queries are large and complex and after all - this whole problem happens with SmartSQL queries only, right? No. It happens on any type of query and happens for a different reason altogether. But it is more prononunced on SmartSQL queries.
What is a SmartSQL query? It is a query retrieving all page records, including flowfield records, in one call (or three altogether on a page, to be precise). It consists of a main query (for underlying soruce table) and a joined subquery per flowfield added to the page. It does not matter if you make the flowfield visible or not, as long as it is a part of page metadata, it will be included in data retrieval.
Now what is characteristic for these queries is that they don't cache. So if a query plan of the 'main' query or any of joined queries is suboptimal, this inefficiency is amplified. And following this logic, this is the same for NAV Query objects. They too generate JOINs and these queries don't cache. In practice this means that if any of the underlying query plans is inefficient, and the underlying table that it is using is large, your page will take longer time to open. And not because we are using SmartSQL queries, but because the query plan is inefficient and is so whether as a part of SmartSQL query, or as a single, simple query we are traditionally used to.
So how to deal with this? Essentially, find a good index. Let me illustrate.
The example below shows the process, the details and complexity will vary in different scenarios. To troubleshoot, a sql trace will suffice. It is recommended to troubleshoot this on an isolated environment, to leave out any surrounding noise.
Create a standard SQL trace, adding following events: Performance: ShowplanXML and Stored Procedure: StmtCompleted.The first will make sure you know what statement is executed on each sp call and the second will make sure you can see the Query Plan executed for each query sent to the server. Because it is here our Bogeyman is hiding.
Run the trace while opening the page, scroll through the completed trace looking for queries with:
- High reads, CPU and long duration
- Starting (typically) with SELECT TOP (50) ISNULL
- Containing one or more OUTER APPLYs (sort of left outer join)
In our example, the query that seems to consume most cpu and time is the following one:
 SELECT ISNULL("Sales Invoice Header"."timestamp",@0) AS "timestamp",ISNULL("Sales Invoice Header"."No_",@1) AS "No_",ISNULL("Sales Invoice Header"."Sell-to Customer No_",@1) AS "Sell-to Customer No_", …… , ISNULL("SUB$Amount"."Amount$Sales Invoice Line$SUM$Amount",@4) AS "Amount",ISNULL("SUB$Amount Including VAT"."Amount Including VAT$Sales Invoice Line$SUM$Amount Including VAT",@4) AS "Amount Including VAT"
FROM " TEST".dbo."CRONUS$Sales Invoice Header" AS "Sales Invoice Header" WITH(READUNCOMMITTED)
OUTER APPLY (SELECT TOP (1) ISNULL(SUM("Amount$Sales Invoice Line"."Amount"),@4) AS "Amount$Sales Invoice Line$SUM$Amount"
FROM "TEST".dbo."CRONUS$Sales Invoice Line" AS "Amount$Sales Invoice Line" WITH(READUNCOMMITTED)
WHERE ("Amount$Sales Invoice Line"."Document No_"="Sales Invoice Header"."No_")) AS "SUB$Amount"
OUTER APPLY (SELECT TOP (1) ISNULL(SUM("Amount Including VAT$Sales Invoice Line"."Amount Including VAT"),@4) AS "Amount Including VAT$Sales Invoice Line$SUM$Amount Including VAT"
FROM "TEST".dbo."CRONUS$Sales Invoice Line" AS "Amount Including VAT$Sales Invoice Line" WITH(READUNCOMMITTED)
WHERE ("Amount Including VAT$Sales Invoice Line"."Document No_"="Sales Invoice Header"."No_")) AS "SUB$Amount Including VAT"
WHERE (ISNULL("Sales Invoice Header"."No_",@1)>@9) ORDER BY "No_" ASC OPTION(OPTIMIZE FOR UNKNOWN, FAST 50)
I have shortened the query above and replaced some of it with '......', and also formatted it a bit for easier overview. You will notice 2 occurences of OUTER APPLY, means 2 flowfields on the page. Now let's look at the accompanying query plan. Once you locate the query in the trace, the query plan will be easy to find - it is easily the most complex one and normally found just above the SmartSQL statement. This is the query plan for the example above:
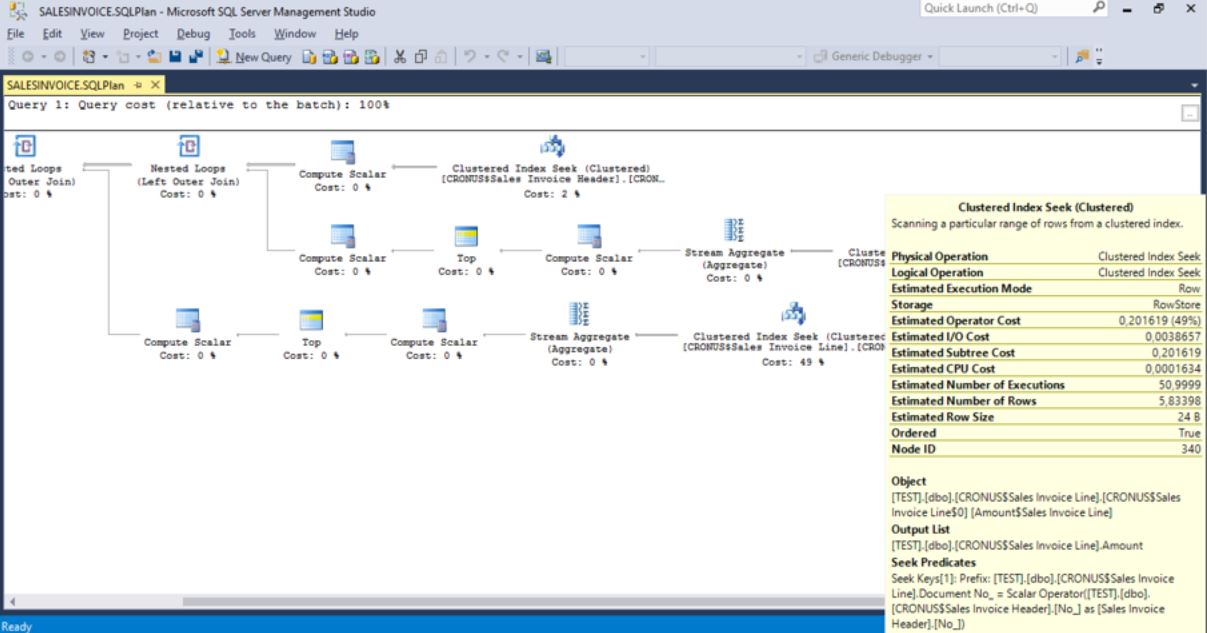
It shows 3 Clustered Index Seeks, whereof two have cost of 49 %. There is a whole science behind reading and interpreting these, but to keep it simple - you only need to locate the subplans with much higher cost, or subplans labeled with Clustered Index Scan, that are used on a table you know is large. These two rules will suffice in most cases. Once you locate those, go back to the extracted query and find the matching subqueries. The below matches the first of the two plans:
SELECT TOP (1) ISNULL(SUM("Amount$Sales Invoice Line"."Amount"),@4) AS "Amount$Sales Invoice Line$SUM$Amount" FROM "TEST".dbo."CRONUS$Sales Invoice Line" AS "Amount$Sales Invoice Line" WITH(READUNCOMMITTED) WHERE ("Amount$Sales Invoice Line"."Document No_"="Sales Invoice Header"."No_")) AS "SUB$Amount"
We are retrieving the value of Amount field (SumIndexField) from Sales Invoice Line for Document No. XXX. If we now check the Sales Invoice Line table keys, we see that primary key Document No., Line No. contains Amount field as SumIndexField, but the MaintainSIFTIndex property of the key is disabled, so the SUM of the field is not stored but computed when SQL query is issued. Enabling this property would speed up the opening og the page.
Now a word of warning too, this particular example is only to illustrate the troubleshooting process. Depending on the scenario - the best solution might be something else. For this particular example, I would consider for example moving the flowfield to a factbox rather then adding SIFTs to the primary key here, to comply with design best practices. The example here is in other words a bit artificial, real-life examples illustrate this much better but are usually tied to custom solutions and scenarios, so this example will have to do for now. If you have examples you can share with public, feel free to contact me.
The main point here is that the problem is essentially in index coverage. Finding the right index will solve this.
At this point it is also worth mentioning that some might be tempted to address the issue by disabling SmartSQL queries (option available onpremise). This would be a very bad idea and is abslutely not recommended for the simple reason that it would not solve the underlying problem of the poor query plan, it would only shift the symptoms from opening the page to scrolling the page. Page might then open faster, but will scroll slower. In addition, one would lose the advantage of SmartSQL queries, thus increasing server roundtrips significantly. Which also means that no migration to cloud would perform until the problem is solved.
The only good solution is improving the query plan by adding the adequate index. That will make both opening and scrolling the page fast, in all environments. And farewell to Bogeyman.