NAV 2009 - How to generate charts / KPIs
Microsoft Dynamics NAV 2009 has a new graphical object type called Charts or KPIs (Key Performance indicators). It is a way to create simple graphical charts, to give a visual overview of key figures. This post describes what you can and cannot do with charts, and it contains some sample code to how you might create a "Chart Generator Tool" to make it easier to generate new charts.
What you can and can't do with charts:
- A chart must be based on 1 table, and 1 table only. You can't combine data from multiple tables.
- You have two basic chart types: Points or Columns.
- You can have any colour as long as you want green.
- Charts can use one of two operators: Sum or Count.
- You can only apply static filters in charts, i.e. you must type in (hardcode) the filter when you generate the chart.
The layout of a chart:
A chart has a simple layout. You choose the table to base it on, then a field from that table to show along the X-Axis, and - if needed - a filter on this table. Then you select what data from the table to show on the Y-Axis (also called Measure). A measure can be based on Sum or Count. You can display multiple measures in the same chart.
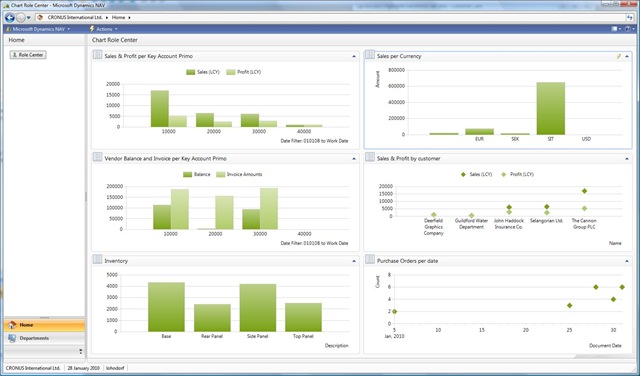
This is what your charts could look like:
Showing a chart:
Charts can only be displayed in the new NAV 2009 client. To display a chart, follow these steps:
- Start the new client, then click on the "Customize" button in the top right corner (just left of the ?-button), and select "Customize this page".
- From there you can add a new Chart part. So add one of them, move it left / right / up and down to where on the page you want it.
- Click the "Customize Part"-button to select which chart to display. This button looks up into the Chart-table in NAV (table 2000000078) and lets you select a chart.
Removing a chart:
You can personalize the page again to remove a chart, or click "Restore Defaults" to remove any personalization. You can also remove any personalization (including any charts that a user has added) with the classic client, from table 2000000075 "User Metadata". This is the table that stores the personalization for each page for each user. Deleting a record from this table removes any personalization made to that page by that user.
Chart objects:
Charts are stored in system table 2000000078 "Chart". You can view them with form 9182 Charts, or from Administration -> Application Setup -> Role Tailored Client -> Charts.
Charts are defined by xml documents which are stored as BLOB fields. You can export a chart to an xml document, then modify the xml document, and import it back as a new chart.
This is an example of a chart definition:
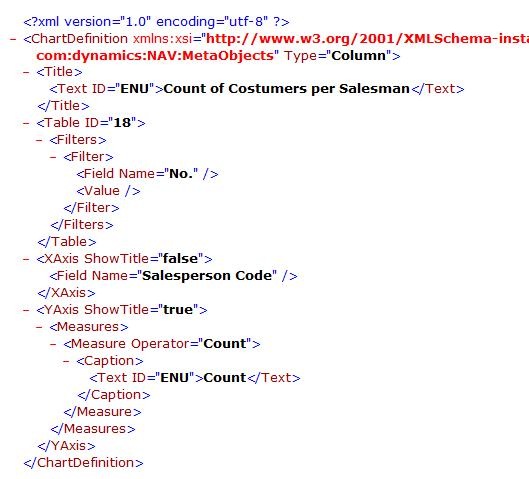
The rules for the xml documents are:
- You must specify exactly one Table ID.
- You can only have one X-Axis.
- You can only have one Filters-element, but it can contain multiple Filter-elements.
- You can only have ony Y-Axis, but it can contain multiple measures.
- Measure operator must be either Count or Sum.
Ideas for a Chart Generator Tool (CGT):
Modifying xml documents can be tedious. But it can be made easier with tools. Below, I have put some sample NAV code, how such a tool could be made.
Note !!!! ===
The code below is only supplied as an example of how such a tool could be made. It is completely un-supported and to be used at your own risk and responsibility.
====
The code below is provided in Text format. When importing text objects into NAV directly, you will not get any warnings whether to overwrite existing objects. So each object has been deliberately changed by adding [RemoveMe] in front of each Object ID. This would have to be removed, after reviewing each Object type and number, to check that it would not overwrite any existing objects!
This is how the tool would work:
the tool contains the following objects:
Type ID Name
1 72000 Chart Generator
1 72001 Chart Generator Filter
1 72003 Chart Generator YAxis
2 72000 Chart Generator List
2 72001 Chart Filters
2 72003 YAxis List
2 72004 Chart Generator Card
5 72000 Chart Generator Mgt
Charts can be generated from form 72004 "Chart Generator Card":
Hit F3 to create a new chart. Enter ID and a Name. As a minimum you must specify Title, "Table ID", "X-Axis Field Name", and one or more Y-Axis fields. Once you have specified the chart definition, then click on Chart -> "Generate Chart". This will automatically either update an existing chart, or generate a new chart in table 2000000078, ready to be used from the new client.
The following example shows how to create a chart to show Inventory for certain items:
- Create a new chart (F3) from the Chart Generator card. As ID, specify INVENTORY.
- As name, also enter Inventory.
- Set Table ID = 27 (Item).
- Leave Type as Column, and select what to display along the X-Axis - let's choose Description.
- Click on Chart -> Y-Axis (or drill down on the "YAxis Fields"-field). This is where we choose the measure, in our case Inventory. So look up in the field "Y-Axis Measure Field ID" and select Inventory.
- Leave the Caption, and the "Measure operator" to their default values, and go back to the Card Generator form.
- Finally, to avoid showing 100s of items on the chart, click on chart -> Filters.
- In the Filters-list, look up in the field "Filter Field ID" and select "No.", then enter a filter value of 70000|70001|70002|70003
Now the definition of the chart is done. To make it available in the new client, click chart -> Generate Chart (F11). If you want to change the chart definition, then just make the necessary changes from the "Chart Generator Card", then hit F11 again to update the existing chart.
Now the chart will be available for the new client as described above. If you update the chart, then the new client will use the new chart definition next time you restart it.
These postings are provided "AS IS" with no warranties and confer no rights. You assume all risk for your use.
Lars Lohndorf-Larsen
Microsoft Dynamics UK
Microsoft Customer Service and Support (CSS) EMEA
=== sample code only ===
===
Updated 19/10 2008
Updated version of the tool on this post:
3D charts. Chart Generator tool II
This version of the tool also has Z-axis for 3D charts
===
OBJECT Table [RemoveMe]72000 Chart Generator
{
OBJECT-PROPERTIES
{
Date=19/08/08;
Time=09:13:04;
Modified=Yes;
Version List=CGT;
}
PROPERTIES
{
OnInsert=BEGIN
IF Chart.GET(Company,ID) THEN
ERROR('Chart already exists in table 2000000078. Run form 9182 and delete it, or use a different ID.');
END;
LookupFormID=Form72000;
}
FIELDS
{
{ 1 ; ;Company ;Text30 }
{ 2 ; ;ID ;Code20 ;NotBlank=Yes }
{ 10 ; ;Name ;Text50 ;OnValidate=BEGIN
Title := Name;
END;
}
{ 11 ; ;Title ;Text50 }
{ 15 ; ;Type ;Option ;OptionString=Column,Point }
{ 16 ; ;Table ID ;Integer ;OnValidate=BEGIN
MODIFY;
END;
}
{ 17 ; ;Table Name ;Text30 ;FieldClass=FlowField;
CalcFormula=Lookup(Object.Name WHERE (Type=CONST(Table),
ID=FIELD(Table ID)));
Editable=No }
{ 20 ; ;XAxis Field ID ;Integer }
{ 21 ; ;XAxis Field Name ;Text80 ;OnValidate=BEGIN
IF "XAxis Field Name" <> '' THEN BEGIN
FieldRec.SETRANGE(TableNo,"Table ID");
FieldRec.SETRANGE(FieldName,"XAxis Field Name");
FieldRec.FINDFIRST;
"XAxis Field ID" := FieldRec."No.";
"XAxis Field Name" := FieldRec.FieldName;
"XAxis Field Caption" := FieldRec."Field Caption";
"XAxis title" := FieldRec."Field Caption";
END ELSE BEGIN
"XAxis Field ID" := 0;
"XAxis Field Name" := '';
"XAxis Field Caption" := '';
"XAxis title" := '';
END;
END;
}
{ 22 ; ;XAxis Field Caption ;Text80 }
{ 23 ; ;XAxis title ;Text80 }
{ 24 ; ;Show Title ;Boolean ;InitValue=Yes }
{ 30 ; ;YAxis fields ;Integer ;FieldClass=FlowField;
CalcFormula=Count("Chart Generator YAxis" WHERE (Company=FIELD(Company),
ID=FIELD(ID)));
Editable=No }
}
KEYS
{
{ ;Company,ID ;Clustered=Yes }
}
FIELDGROUPS
{
}
CODE
{
VAR
Chart@1000 : Record 2000000078;
FieldRec@1102601000 : Record 2000000041;
BEGIN
END.
}
}
OBJECT Table [RemoveMe]72001 Chart Generator Filter
{
OBJECT-PROPERTIES
{
Date=19/08/08;
Time=16:44:37;
Modified=Yes;
Version List=CGT;
}
PROPERTIES
{
OnInsert=BEGIN
TESTFIELD("Filter Field ID");
END;
}
FIELDS
{
{ 1 ; ;Company ;Text30 }
{ 2 ; ;ID ;Code20 }
{ 3 ; ;Line No. ;Integer }
{ 10 ; ;Filter Field ID ;Integer ;OnValidate=BEGIN
IF "Filter Field ID" <> 0 THEN BEGIN
ChartGen.GET(Company,ID);
ChartGen.TESTFIELD("Table ID");
FieldRec.GET(ChartGen."Table ID","Filter Field ID");
"Filter Field Name" := FieldRec.FieldName;
END ELSE
"Filter Field Name" := '';
END;
}
{ 11 ; ;Filter Field Name ;Text30 }
{ 15 ; ;Filter Value ;Text30 }
}
KEYS
{
{ ;Company,ID,Line No. ;Clustered=Yes }
}
FIELDGROUPS
{
}
CODE
{
VAR
ChartGen@1102601001 : Record 72000;
FieldRec@1102601000 : Record 2000000041;
BEGIN
END.
}
}
OBJECT Table [RemoveMe]72003 Chart Generator YAxis
{
OBJECT-PROPERTIES
{
Date=19/08/08;
Time=07:26:24;
Modified=Yes;
Version List=CGT;
}
PROPERTIES
{
OnInsert=BEGIN
TESTFIELD("YAxis Measure Field ID");
END;
LookupFormID=Form72003;
DrillDownFormID=Form72003;
}
FIELDS
{
{ 1 ; ;Company ;Text30 }
{ 2 ; ;ID ;Code20 }
{ 3 ; ;Line No. ;Integer }
{ 10 ; ;YAxis Measure Field ID;Integer }
{ 11 ; ;YAxis Measure Field Caption;Text30 }
{ 12 ; ;Mearure Operator ;Option ;OptionString=Sum,Count }
{ 20 ; ;Show Title ;Boolean }
}
KEYS
{
{ ;Company,ID,Line No. ;Clustered=Yes }
}
FIELDGROUPS
{
}
CODE
{
BEGIN
END.
}
}
OBJECT Form [RemoveMe]72000 Chart Generator List
{
OBJECT-PROPERTIES
{
Date=12/08/08;
Time=06:50:19;
Modified=Yes;
Version List=CGT;
}
PROPERTIES
{
Width=16500;
Height=6710;
TableBoxID=1;
SourceTable=Table72000;
}
CONTROLS
{
{ 1 ;TableBox ;220 ;220 ;16060;5500 ;HorzGlue=Both;
VertGlue=Both }
{ 2 ;TextBox ;0 ;0 ;4400 ;0 ;HorzGlue=Both;
Visible=No;
ParentControl=1;
InColumn=Yes;
SourceExpr=Company }
{ 3 ;Label ;0 ;0 ;0 ;0 ;ParentControl=2;
InColumnHeading=Yes }
{ 4 ;TextBox ;0 ;0 ;1700 ;0 ;ParentControl=1;
InColumn=Yes;
SourceExpr=ID }
{ 5 ;Label ;0 ;0 ;0 ;0 ;ParentControl=4;
InColumnHeading=Yes }
{ 6 ;TextBox ;0 ;0 ;4400 ;0 ;ParentControl=1;
InColumn=Yes;
SourceExpr=Name }
{ 7 ;Label ;0 ;0 ;0 ;0 ;ParentControl=6;
InColumnHeading=Yes }
{ 8 ;TextBox ;0 ;0 ;4400 ;0 ;ParentControl=1;
InColumn=Yes;
SourceExpr=Title }
{ 9 ;Label ;0 ;0 ;0 ;0 ;ParentControl=8;
InColumnHeading=Yes }
{ 10 ;TextBox ;0 ;0 ;550 ;0 ;ParentControl=1;
InColumn=Yes;
SourceExpr=Type }
{ 11 ;Label ;0 ;0 ;0 ;0 ;ParentControl=10;
InColumnHeading=Yes }
{ 12 ;TextBox ;0 ;0 ;1700 ;0 ;ParentControl=1;
InColumn=Yes;
SourceExpr="Table ID" }
{ 13 ;Label ;0 ;0 ;0 ;0 ;ParentControl=12;
InColumnHeading=Yes }
{ 14 ;CommandButton;4400 ;5940 ;2200 ;550 ;HorzGlue=Right;
VertGlue=Bottom;
Default=Yes;
PushAction=LookupOK;
InvalidActionAppearance=Hide }
{ 15 ;CommandButton;6820 ;5940 ;2200 ;550 ;HorzGlue=Right;
VertGlue=Bottom;
Cancel=Yes;
PushAction=LookupCancel;
InvalidActionAppearance=Hide }
{ 16 ;CommandButton;14080;5940 ;2200 ;550 ;HorzGlue=Right;
VertGlue=Bottom;
PushAction=FormHelp }
{ 17 ;MenuButton ;9240 ;5940 ;2200 ;550 ;HorzGlue=Right;
VertGlue=Bottom;
CaptionML=ENU=Chart;
Menu=MENUITEMS
{
{ ID=18;
PushAction=RunObject;
CaptionML=ENU=Filters;
RunObject=Form 72001;
RunFormLink=Company=FIELD(Company),
ID=FIELD(ID) }
{ ID=20;
PushAction=RunObject;
CaptionML=ENU=XAxis;
RunObject=Form 72002;
RunFormLink=Field1=FIELD(Company),
Field2=FIELD(ID) }
{ ID=21;
PushAction=RunObject;
CaptionML=ENU=YAxis;
RunObject=Form 72003;
RunFormLink=Company=FIELD(Company),
ID=FIELD(ID) }
}
}
{ 19 ;MenuButton ;11660;5940 ;2200 ;550 ;HorzGlue=Right;
VertGlue=Bottom;
CaptionML=ENU=F&unctions;
Menu=MENUITEMS
{
{ ID=22;
PushAction=RunObject;
ShortCutKey=F11;
CaptionML=ENU=Generate Chart;
RunObject=Codeunit 72000 }
}
}
}
CODE
{
VAR
Chart@1000 : Record 2000000078;
BEGIN
END.
}
}
OBJECT Form [RemoveMe]72001 Chart Filters
{
OBJECT-PROPERTIES
{
Date=19/08/08;
Time=09:21:22;
Modified=Yes;
Version List=CGT;
}
PROPERTIES
{
Width=12150;
Height=6710;
TableBoxID=1;
SourceTable=Table72001;
AutoSplitKey=Yes;
DelayedInsert=Yes;
}
CONTROLS
{
{ 1 ;TableBox ;220 ;220 ;11710;5500 ;HorzGlue=Both;
VertGlue=Both }
{ 2 ;TextBox ;0 ;0 ;1700 ;0 ;ParentControl=1;
InColumn=Yes;
SourceExpr="Filter Field ID";
OnLookup=BEGIN
ChartGen.GET(Company,ID);
ChartGen.TESTFIELD("Table ID");
FieldRec.SETRANGE(TableNo,ChartGen."Table ID");
IF FORM.RUNMODAL(FORM::"Field List",FieldRec) = ACTION::LookupOK THEN
VALIDATE("Filter Field ID",FieldRec."No.");
END;
}
{ 3 ;Label ;0 ;0 ;0 ;0 ;ParentControl=2;
InColumnHeading=Yes }
{ 4 ;TextBox ;0 ;0 ;4400 ;0 ;HorzGlue=Both;
ParentControl=1;
InColumn=Yes;
SourceExpr="Filter Field Name" }
{ 5 ;Label ;0 ;0 ;0 ;0 ;ParentControl=4;
InColumnHeading=Yes }
{ 6 ;TextBox ;0 ;0 ;4400 ;0 ;ParentControl=1;
InColumn=Yes;
SourceExpr="Filter Value" }
{ 7 ;Label ;0 ;0 ;0 ;0 ;ParentControl=6;
InColumnHeading=Yes }
{ 8 ;CommandButton;4890 ;5940 ;2200 ;550 ;HorzGlue=Right;
VertGlue=Bottom;
Default=Yes;
PushAction=LookupOK;
InvalidActionAppearance=Hide }
{ 9 ;CommandButton;7310 ;5940 ;2200 ;550 ;HorzGlue=Right;
VertGlue=Bottom;
Cancel=Yes;
PushAction=LookupCancel;
InvalidActionAppearance=Hide }
{ 10 ;CommandButton;9730 ;5940 ;2200 ;550 ;HorzGlue=Right;
VertGlue=Bottom;
PushAction=FormHelp }
}
CODE
{
VAR
ChartGen@1000 : Record 72000;
FieldRec@1001 : Record 2000000041;
BEGIN
END.
}
}
OBJECT Form [RemoveMe]72003 YAxis List
{
OBJECT-PROPERTIES
{
Date=19/08/08;
Time=07:31:05;
Modified=Yes;
Version List=CGT;
}
PROPERTIES
{
Width=10000;
Height=6710;
TableBoxID=1;
SourceTable=Table72003;
AutoSplitKey=Yes;
DelayedInsert=Yes;
}
CONTROLS
{
{ 1 ;TableBox ;220 ;220 ;9560 ;5500 ;HorzGlue=Both;
VertGlue=Both }
{ 2 ;TextBox ;0 ;0 ;1700 ;0 ;ParentControl=1;
InColumn=Yes;
SourceExpr="YAxis Measure Field ID";
OnLookup=BEGIN
ChartGen.GET(Company,ID);
ChartGen.TESTFIELD("Table ID");
FieldRec.SETRANGE(TableNo,ChartGen."Table ID");
IF FORM.RUNMODAL(FORM::"Field List",FieldRec) = ACTION::LookupOK THEN BEGIN
"YAxis Measure Field ID" := FieldRec."No.";
"YAxis Measure Field Caption" := FieldRec."Field Caption";
END;
END;
}
{ 3 ;Label ;0 ;0 ;0 ;0 ;ParentControl=2;
InColumnHeading=Yes }
{ 4 ;TextBox ;0 ;0 ;4400 ;0 ;HorzGlue=Both;
ParentControl=1;
InColumn=Yes;
SourceExpr="YAxis Measure Field Caption" }
{ 5 ;Label ;0 ;0 ;0 ;0 ;ParentControl=4;
InColumnHeading=Yes }
{ 6 ;TextBox ;0 ;0 ;550 ;0 ;ParentControl=1;
InColumn=Yes;
SourceExpr="Mearure Operator" }
{ 7 ;Label ;0 ;0 ;0 ;0 ;ParentControl=6;
InColumnHeading=Yes }
{ 8 ;CheckBox ;0 ;0 ;1700 ;0 ;ParentControl=1;
InColumn=Yes;
ShowCaption=No;
SourceExpr="Show Title" }
{ 9 ;Label ;0 ;0 ;0 ;0 ;ParentControl=8;
InColumnHeading=Yes }
{ 10 ;CommandButton;2740 ;5940 ;2200 ;550 ;HorzGlue=Right;
VertGlue=Bottom;
Default=Yes;
PushAction=LookupOK;
InvalidActionAppearance=Hide }
{ 11 ;CommandButton;5160 ;5940 ;2200 ;550 ;HorzGlue=Right;
VertGlue=Bottom;
Cancel=Yes;
PushAction=LookupCancel;
InvalidActionAppearance=Hide }
{ 12 ;CommandButton;7580 ;5940 ;2200 ;550 ;HorzGlue=Right;
VertGlue=Bottom;
PushAction=FormHelp }
}
CODE
{
VAR
ChartGen@1000 : Record 72000;
FieldRec@1001 : Record 2000000041;
BEGIN
END.
}
}
OBJECT Form [RemoveMe]72004 Chart Generator Card
{
OBJECT-PROPERTIES
{
Date=19/08/08;
Time=08:17:28;
Modified=Yes;
Version List=CGT;
}
PROPERTIES
{
Width=16170;
Height=6490;
SourceTable=Table72000;
}
CONTROLS
{
{ 1 ;TabControl ;220 ;220 ;15730;5280 ;HorzGlue=Both;
VertGlue=Both;
PageNamesML=ENU=General }
{ 4 ;TextBox ;3850 ;990 ;2750 ;440 ;ParentControl=1;
InPage=0;
SourceExpr=ID }
{ 5 ;Label ;440 ;990 ;3300 ;440 ;ParentControl=4 }
{ 6 ;TextBox ;3850 ;1650 ;5500 ;440 ;ParentControl=1;
InPage=0;
NextControl=12;
SourceExpr=Name }
{ 7 ;Label ;440 ;1650 ;3300 ;440 ;ParentControl=6 }
{ 8 ;TextBox ;3850 ;2200 ;5500 ;440 ;ParentControl=1;
InPage=0;
SourceExpr=Title }
{ 9 ;Label ;440 ;2200 ;3300 ;440 ;ParentControl=8 }
{ 10 ;TextBox ;3850 ;3520 ;2750 ;440 ;ParentControl=1;
InPage=0;
SourceExpr=Type }
{ 11 ;Label ;440 ;3520 ;3300 ;440 ;ParentControl=10 }
{ 12 ;TextBox ;3850 ;2860 ;1700 ;440 ;ParentControl=1;
InPage=0;
SourceExpr="Table ID";
OnLookup=BEGIN
Object.SETRANGE(Type,Object.Type::Table);
IF FORM.RUNMODAL(FORM::Objects,Object) = ACTION::LookupOK THEN
"Table ID" := Object.ID;
END;
OnAfterValidate=BEGIN
CALCFIELDS("Table Name");
END;
}
{ 13 ;Label ;440 ;2860 ;3300 ;440 ;ParentControl=12 }
{ 21 ;TextBox ;12980;990 ;2750 ;440 ;ParentControl=1;
InPage=0;
NextControl=1102601000;
SourceExpr="XAxis Field Name";
OnLookup=BEGIN
TESTFIELD("Table ID");
FieldRec.SETRANGE(TableNo,"Table ID");
IF FORM.RUNMODAL(FORM::"Field List",FieldRec) = ACTION::LookupOK THEN
VALIDATE("XAxis Field Name",FieldRec.FieldName);
END;
}
{ 22 ;Label ;9570 ;990 ;3300 ;440 ;ParentControl=21 }
{ 20 ;TextBox ;12980;1650 ;2750 ;440 ;ParentControl=1;
InPage=0;
SourceExpr="XAxis Field Caption" }
{ 23 ;Label ;9570 ;1650 ;3300 ;440 ;ParentControl=20 }
{ 24 ;CheckBox ;12980;2750 ;440 ;440 ;ParentControl=1;
InPage=0;
ShowCaption=No;
SourceExpr="Show Title" }
{ 25 ;Label ;9570 ;2750 ;3300 ;440 ;ParentControl=24 }
{ 27 ;TextBox ;12980;2200 ;2750 ;440 ;ParentControl=1;
InPage=0;
SourceExpr="XAxis title" }
{ 28 ;Label ;9570 ;2200 ;3300 ;440 ;ParentControl=27 }
{ 1102601000;TextBox;12980;3410 ;1700 ;440 ;ParentControl=1;
InPage=0;
SourceExpr="YAxis fields" }
{ 1102601001;Label ;9570 ;3410 ;3300 ;440 ;ParentControl=1102601000 }
{ 1102601002;TextBox;5720 ;2860 ;3630 ;440 ;ParentControl=1;
InPage=0;
SourceExpr="Table Name" }
{ 14 ;CommandButton;13750;5720 ;2200 ;550 ;HorzGlue=Right;
VertGlue=Bottom;
PushAction=FormHelp }
{ 15 ;MenuButton ;11330;5720 ;2200 ;550 ;HorzGlue=Right;
VertGlue=Bottom;
CaptionML=ENU=&Chart;
Menu=MENUITEMS
{
{ ID=16;
PushAction=LookupTable;
ShortCutKey=F5;
CaptionML=ENU=L&ist }
{ ID=26;
PushAction=RunObject;
CaptionML=ENU=Filters;
RunObject=Form 72001;
RunFormLink=Company=FIELD(Company),
ID=FIELD(ID) }
{ ID=17;
PushAction=RunObject;
CaptionML=ENU=YAxis;
RunObject=Form 72003;
RunFormLink=Company=FIELD(Company),
ID=FIELD(ID) }
{ ID=18;
MenuItemType=Separator }
{ ID=19;
PushAction=RunObject;
ShortCutKey=F11;
CaptionML=ENU=Generate Chart;
RunObject=Codeunit 72000 }
}
}
}
CODE
{
VAR
FieldRec@1001 : Record 2000000041;
Object@1002 : Record 2000000001;
XAxisField@1000 : Text[30];
BEGIN
END.
}
}
OBJECT Codeunit [RemoveMe]72000 Chart Generator Mgt
{
OBJECT-PROPERTIES
{
Date=19/08/08;
Time=16:47:56;
Modified=Yes;
Version List=CGT;
}
PROPERTIES
{
TableNo=72000;
OnRun=BEGIN
CreateXML(Rec);
MESSAGE('Chart %1 was created / updated.',Chart.ID);
END;
}
CODE
{
VAR
Chart@1015 : Record 2000000078;
ChartGen@1003 : Record 72000;
ChartFilters@1008 : Record 72001;
ChartYAxis@1012 : Record 72003;
"3TierMgt"@1013 : Codeunit 419;
XMLDoc@1000 : Automation "{F5078F18-C551-11D3-89B9-0000F81FE221} 4.0:{F6D90F11-9C73-11D3-B32E-00C04F990BB4}:'Microsoft XML, v4.0'.DOMDocument";
DomNode@1001 : Automation "{F5078F18-C551-11D3-89B9-0000F81FE221} 4.0:{2933BF80-7B36-11D2-B20E-00C04F983E60}:'Microsoft XML, v4.0'.IXMLDOMNode";
DomNode2@1006 : Automation "{F5078F18-C551-11D3-89B9-0000F81FE221} 4.0:{2933BF80-7B36-11D2-B20E-00C04F983E60}:'Microsoft XML, v4.0'.IXMLDOMNode";
DomTextNode@1002 : Automation "{F5078F18-C551-11D3-89B9-0000F81FE221} 4.0:{2933BF87-7B36-11D2-B20E-00C04F983E60}:'Microsoft XML, v4.0'.IXMLDOMText";
DomAttribute@1004 : Automation "{F5078F18-C551-11D3-89B9-0000F81FE221} 4.0:{2933BF85-7B36-11D2-B20E-00C04F983E60}:'Microsoft XML, v4.0'.IXMLDOMAttribute";
DomNodeList@1009 : Automation "{F5078F18-C551-11D3-89B9-0000F81FE221} 4.0:{2933BF82-7B36-11D2-B20E-00C04F983E60}:'Microsoft XML, v4.0'.IXMLDOMNodeList";
DomProcessInstruction@1005 : Automation "{F5078F18-C551-11D3-89B9-0000F81FE221} 4.0:{2933BF89-7B36-11D2-B20E-00C04F983E60}:'Microsoft XML, v4.0'.IXMLDOMProcessingInstruction";
NameSpace@1007 : Text[80];
i@1010 : Integer;
TempFileName@1014 : Text[250];
Debug@1016 : Boolean;
DebugFileName@1102601000 : Text[250];
IStream@1102601001 : InStream;
PROCEDURE CreateXML@1(ChartGenerator@1000 : Record 72000);
BEGIN
//=== Enable debug and filename to save the xml document to disk
Debug := FALSE;
DebugFileName := '';
//===
CREATE(XMLDoc);
XMLDoc.async(FALSE);
// Initialize document and set namespaces
NameSpace := 'urn:schemas-microsoft-com:dynamics:NAV:MetaObjects';
DomNode := XMLDoc.createNode(1,'ChartDefinition',NameSpace);
DomAttribute := XMLDoc.createAttribute('xmlns:xsd');
DomAttribute.value := 'https://www.w3.org/2001/XMLSchema';
DomNode.attributes.setNamedItem(DomAttribute);
DomAttribute := XMLDoc.createAttribute('xmlns:xsi');
DomAttribute.value := 'https://www.w3.org/2001/XMLSchema-instance';
DomNode.attributes.setNamedItem(DomAttribute);
// add chart type
DomAttribute := XMLDoc.createAttribute('Type');
CASE ChartGenerator.Type OF
ChartGenerator.Type::Column:
DomAttribute.value := 'Column';
ChartGenerator.Type::Point:
DomAttribute.value := 'Point';
END;
DomNode.attributes.setNamedItem(DomAttribute);
XMLDoc.appendChild(DomNode);
AddNode('ChartDefinition','Title','');
AddNode('ChartDefinition/Title','Text',ChartGenerator.Title);
AddAttribute('ChartDefinition/Title/Text','ID','ENU');
AddNode('ChartDefinition','Table','');
AddAttribute('ChartDefinition/Table','ID',FORMAT(ChartGenerator."Table ID"));
AddNode('ChartDefinition/Table','Filters','');
// Filters
ChartFilters.SETRANGE(Company,ChartGenerator.Company);
ChartFilters.SETRANGE(ID,ChartGenerator.ID);
IF ChartFilters.FINDSET THEN
REPEAT
AddNode('ChartDefinition/Table/Filters','Filter','');
AddNode('ChartDefinition/Table/Filters/Filter','Field','');
AddAttribute('ChartDefinition/Table/Filters/Filter/Field','Name',ChartFilters."Filter Field Name");
AddNode('ChartDefinition/Table/Filters/Filter','Value',ChartFilters."Filter Value");
UNTIL ChartFilters.NEXT = 0;
// XAxis
ChartGenerator.TESTFIELD("XAxis Field Name");
AddNode('ChartDefinition','XAxis','');
AddAttribute('ChartDefinition/XAxis','ShowTitle',BooleanFormat(ChartGenerator."Show Title")); ///
AddNode('ChartDefinition/XAxis','Title','');
AddNode('ChartDefinition/XAxis/Title','Text',ChartGenerator."XAxis title");
AddAttribute('ChartDefinition/XAxis/Title/Text','ID','ENU');
AddNode('ChartDefinition/XAxis','Field','');
AddAttribute('ChartDefinition/XAxis/Field','Name',ChartGenerator."XAxis Field Name");
// YAxis
ChartYAxis.SETRANGE(Company,ChartGenerator.Company);
ChartYAxis.SETRANGE(ID,ChartGenerator.ID);
IF ChartYAxis.FINDSET THEN BEGIN
AddNode('ChartDefinition','YAxis','');
AddAttribute('ChartDefinition/YAxis','ShowTitle',BooleanFormat(ChartYAxis."Show Title"));
AddNode('ChartDefinition/YAxis','Measures','');
REPEAT
AddNode('ChartDefinition/YAxis/Measures','Measure','');
AddAttribute('ChartDefinition/YAxis/Measures/Measure','Operator',FORMAT(ChartYAxis."Mearure Operator"));
AddNode('ChartDefinition/YAxis/Measures/Measure','Field','');
AddAttribute('ChartDefinition/YAxis/Measures/Measure/Field','Name',FORMAT(ChartYAxis."YAxis Measure Field Caption"));
UNTIL ChartYAxis.NEXT = 0;
END;
TempFileName := TEMPORARYPATH + '\' + FORMAT(CREATEGUID) + '.xml';
XMLDoc.save(TempFileName);
IF NOT Chart.GET(ChartGenerator.Company,ChartGenerator.ID) THEN BEGIN
Chart.Company := ChartGenerator.Company;
Chart.ID := ChartGenerator.ID;
Chart.Name := ChartGenerator.Name;
Chart.INSERT;
END;
Chart.BLOB.IMPORT(TempFileName);
Chart.MODIFY;
IF Debug THEN
XMLDoc.save(DebugFileName);
// Clean up
IF EXISTS(TempFileName) THEN
ERASE(TempFileName);
CLEAR(DomNode);
CLEAR(XMLDoc);
END;
PROCEDURE AddNode@2(AddToNode@1000 : Text[120];NodeName@1001 : Text[120];NodeValue@1002 : Text[120]);
BEGIN
DomNodeList := XMLDoc.selectNodes(AddToNode);
DomNode := DomNodeList.item(DomNodeList.length - 1);
DomNode2 := XMLDoc.createNode(1,NodeName,NameSpace);
DomTextNode := XMLDoc.createTextNode(NodeValue);
DomNode2.appendChild(DomTextNode);
DomNode.appendChild(DomNode2);
END;
PROCEDURE AddAttribute@3(AddToNode@1000 : Text[120];AttributeName@1001 : Text[120];AttributeValue@1002 : Text[120]);
BEGIN
DomNodeList := XMLDoc.selectNodes(AddToNode);
DomNode := DomNodeList.item(DomNodeList.length - 1);
DomAttribute := XMLDoc.createAttribute(AttributeName);
DomAttribute.value := AttributeValue;
DomNode.attributes.setNamedItem(DomAttribute);
END;
PROCEDURE BooleanFormat@4(Boo@1000 : Boolean) : Text[30];
BEGIN
IF Boo THEN
EXIT('true');
EXIT('false');
END;
EVENT XMLDoc@1000::ondataavailable@198();
BEGIN
END;
EVENT XMLDoc@1000::onreadystatechange@-609();
BEGIN
END;
BEGIN
END.
}
}