
RDLC Export to Excel: Some hints
When you build RDLC reports in Dynamics NAV, you can choose between 5 different output types, also known as rendering extensions:
- Preview (HTML-like, Soft Page-Break)
- Print (Hard Page-Break)
- PDF (Hard Page-Break)
- Word (Soft Page-Break)
- Excel (Soft Page-Break)
Each rendering extension is independent and generated by its own engine, also known as the renderer. In the default version of Dynamics NAV, we’ve mainly used the development target Hard Page-Break renderer for both Print and PDF. But the Excel renderer is also important, and here are some tips and tricks for how to make your RDLC reports work for Print, PDF, and Excel
Remember the renderers in RDLC
The Excel renderer is pretty singular, and its constraints and caveats are described by Microsoft SQL Server Reporting Services (SSRS) team here.
Within the standard reports, you might find out to cope with some adjustment to RDLC layout to meet your customers’ needs when enabling RDLC Excel renderer and exporting a report to Excel.
Apart from the constraint described in the link to the docs above, 3 tips from the field are in scope of this blog post.
Tip #1: Align ALL control border columns to avoid unexpected behaviors
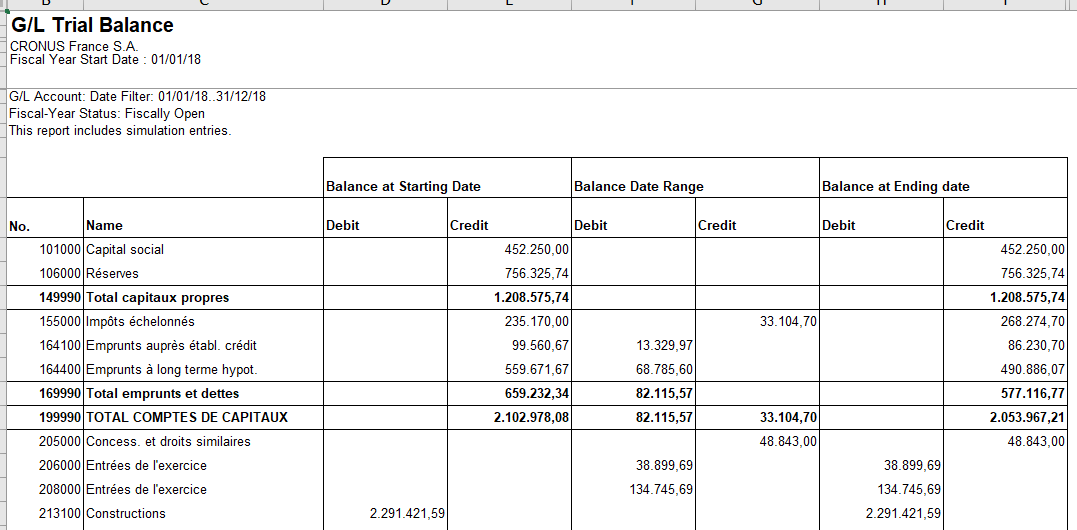
A typical example is the RDLC Export to Excel for standard report 10803 “G/L Trial Balance” in the FR localized version. See below a snippet for the standard Export to Excel file
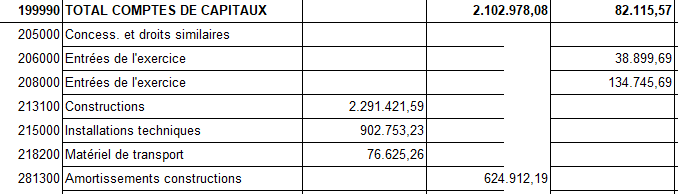
You might notice a strange extra column, without border, between the other column on the right.
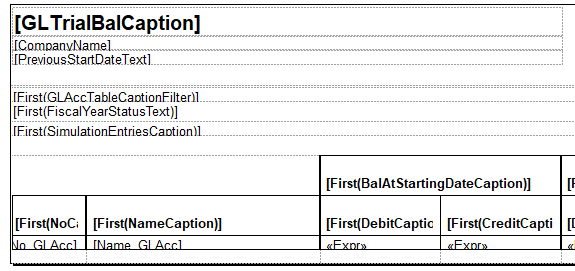
Where this column comes from? When creating the output, the Excel renderer has to determine first how many columns should fit in by considering the whole report surface. Not only the body or single tables.
Stated the above, then, it is trivial to say that Excel renderer in this case would determine the existence of an extra column due to misalignment between the report title textbox control right border and some column in the main Tablix control (highlighted in yellow).

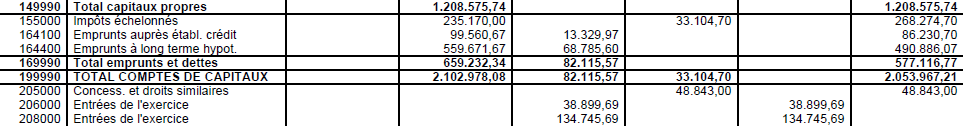
The resolution, in this case, is pretty easy: just drag the offending control border from the header controls until it is perfectly aligned with another rendered column. See below:
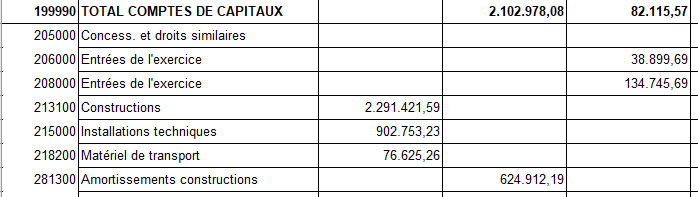
This is the output in the end when enabling the Excel renderer with a fully aligned report
Tip #2: Use RenderFormat.Name Built-In parameter
Within the same report we find out applying this minor issue with Report Viewer that was reported in the Connect tool.
Basically, when switching from border none to solid and back to none. The last sentence is not processed and from that time on, excel export continue to print solid borders. You might see clearly the difference by comparing PDF and Excel rendering output.
EXCEL

And this is where a trick kicks comes in. The core trick is to change the border color from white to black and then back to white, while maintaining the border always solid with something like
BorderColor Top
=IIF(Fields!TLAccType.Value > 0,"Black","White")

BorderColor Bottom
=IIF(Fields!TLAccType.Value > 0,"Black","White")
And now comes a trade-off between Print/PDF renderer and Excel renderer. The basic problem is that implementing the change as above would produce the appropriate Excel output but Print/PDF would result in a messy bad-colored output and, to make the whole changes work, they should stick with the formula in the border color.
And this is exactly where our hero comes into play: RenderFormat.Name.
To resolve the issue and have a beautiful Print/PDF and Excel export experience within the same RDLC Layout definition, we suggest determine the action to take by conditionally triggering the render format using RenderFormat.Name built-in parameter. In this way, when users click on Print or PDF, Report Viewer would enable BorderStyle conditional formatting (Solid or None) while when exporting to Excel would enable BorderColor conditional formatting (Black or White).
In the end, the formula applied in that specific report have been the following:
BorderColor Top
 =IIF(UCase(Globals!RenderFormat.Name)="EXCELOPENXML",IIF(Fields!TLAccType.Value > 0,"Black","White"),"Black")

BorderColor Bottom
 =IIF(UCase(Globals!RenderFormat.Name)="EXCELOPENXML",IIF(Fields!TLAccType.Value > 0,"Black","White"),"Black")

BorderStyle Top
 =IIF(UCase(Globals!RenderFormat.Name)="EXCELOPENXML","Solid",IIF(Fields!TLAccType.Value > 0,"Solid","None"))

BorderStyle Bottom
 =IIF(UCase(Globals!RenderFormat.Name)="EXCELOPENXML","Solid",IIF(Fields!TLAccType.Value > 0,"Solid","None"))
Below the Excel output: et voila’, perfectly synchronized with Print/PDF output.
Tip #3: Use a simple standard format for Decimal values
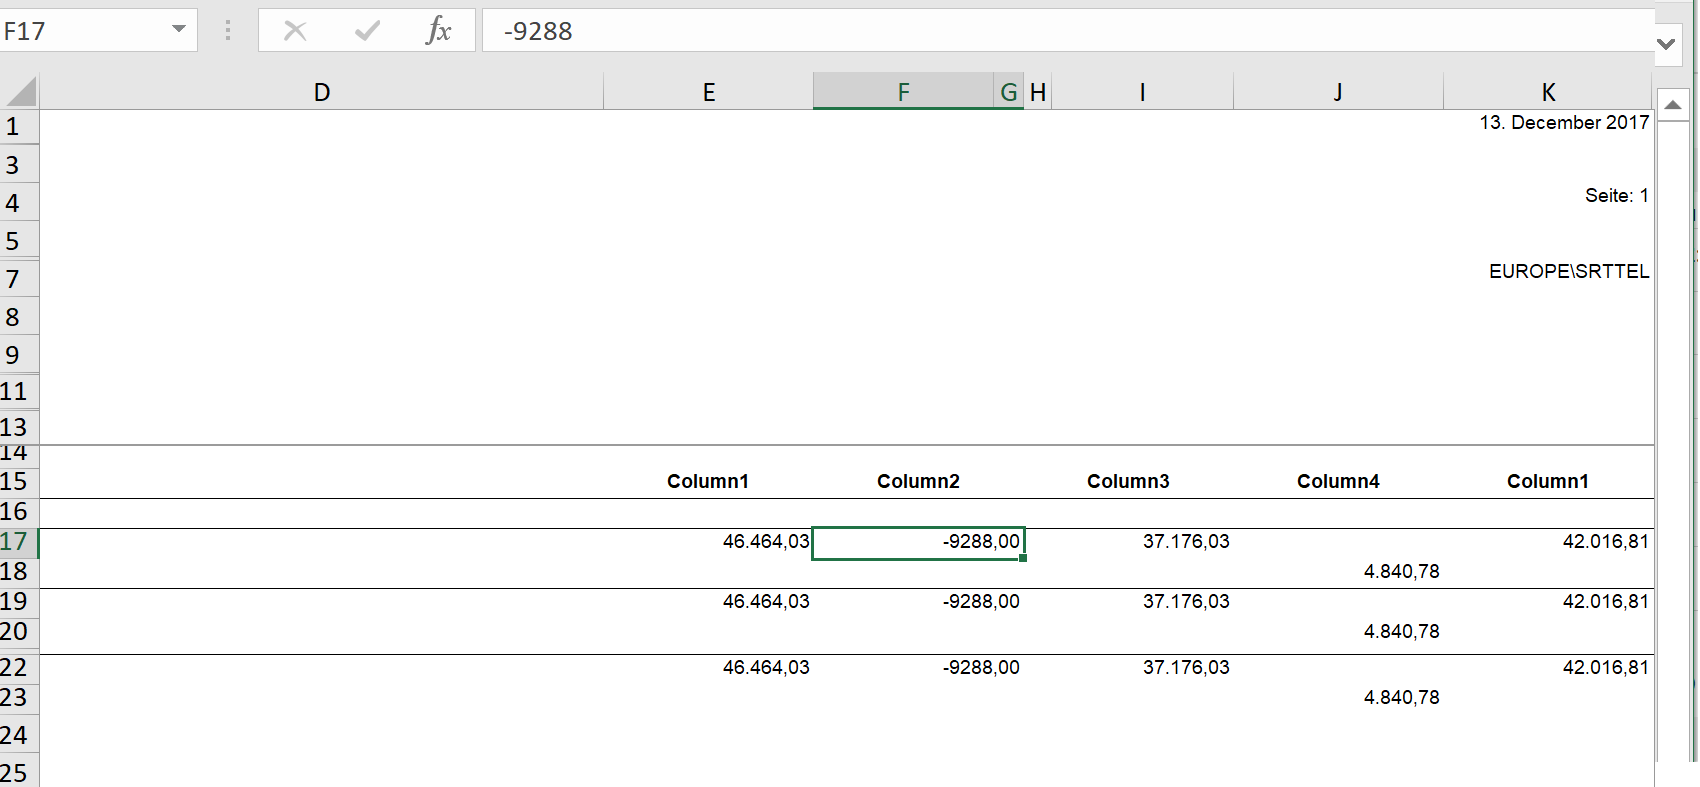
On another self-developed report we found out that a specific column with negative values are not shown when exporting this report to Excel. The values are added to the Excel sheet correctly, but does not recognize the correct format.

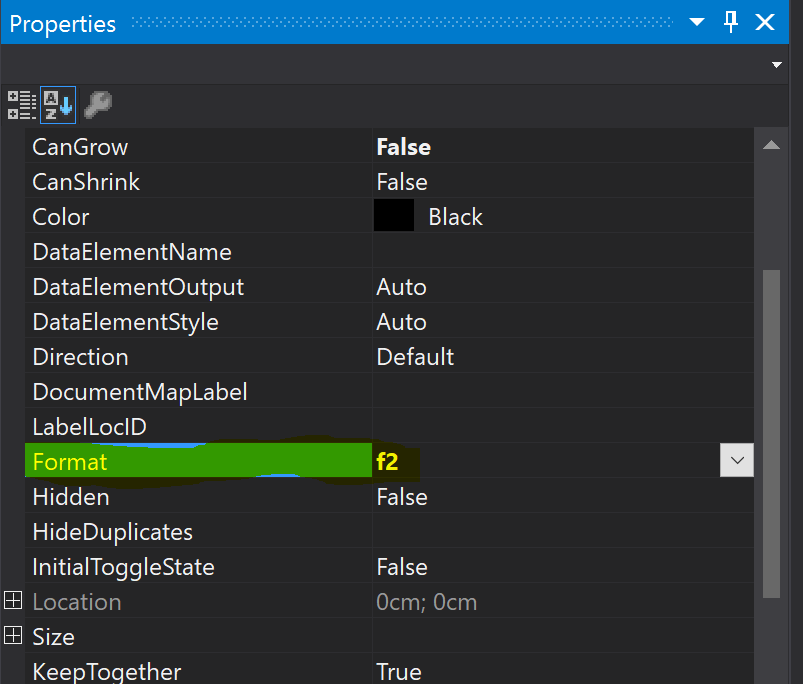
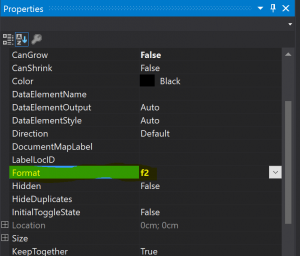
The problem could be resolved with setting the format property of the TextBox of that column F2.
Format = "f2"
After that the values will be correctly formatted in Excel.
These postings are provided “AS IS” with no warranties and confer no rights. You assume all risk for your use.