
Coffee Break: Monitoring and troubleshooting NAV Services, Part III – Performance troubleshooting and profiling User Activity using PowerShell
Since the release of Microsoft Dynamics NAV 2013, tracing user activity has become a bit more complicated than it used to be in earlier versions due to the fact that unlike previously, all user connections to SQL Server are now server connections. Which makes it more difficult to trace individual user activity.
But not impossible: Enabling full C/AL tracing injects comments to SQL Server Profiler with data like User ID, C/AL line executed, call stack, and more.
Still, tracing and analyzing activity pre user on SQL profiler (even with C/AL tracing enabled) can be a complex task. Which is why we introduced Dynamics NAV Application Profiler, a tool that resembles the old Client Profiler.
You can use this tool to profile user(s) activities from a Dynamics NAV page (in much the same way we used to with Client Monitor). But as we’re all about automation in these coffee break posts – this one will show you how you can profile user activity unattended, using Windows PowerShell.
To profile user activity, we can use the tool itself, or Windows Performance Monitor (https://technet.microsoft.com/en-us/library/cc749249.aspx), and data collector sets.
Enable data collector sets in Performance Monitor
To enable data collector sets for event trace (manually), follow these steps:
- Open Performance Monitor.
- Expand Data Collector Sets, right-click User Defined, and then create a new set using the wizard. Choose manual configuration, and then select events of type “Event trace data”.
- Add a provider, and from the list select Microsoft-DynamicsNAV-Server, and then finish the wizard.
This will set up a trace collecting Dynamics NAV data which can be started and stopped as and when needed. It logs data to a .etl file, which can be imported into page 50000 Performance Profiler which comes as part of the NAV Application Profiler mentioned above (Analyze ETL File).
To collect meaningful data, you must have set the EnableFullALFunctionTracing key in the Dynamics NAV Server configuration.
 <!--
 Specifies whether full C/AL function tracing is enabled when an ETW session is performed.
 When this setting is enabled, all C/AL functions and statements are logged in an ETL log file.
 -->
 <add key="EnableFullALFunctionTracing" value="true"/>
So before you proceed here, keep in mind that having the above setting enabled is required to get meaningful data in the profiling process outlined below. The setting can remain enabled on your system, if you want to be able to proactively monitor you service.
Enable data collector sets in Performance Monitor using PowerShell
So first enable EnableFullALFunctionTracing to log full info in the log:
Import-Module 'C:\Program Files\Microsoft Dynamics NAV\80\Service\Microsoft.Dynamics.Nav.Management.dll'
Set-NAVServerConfiguration DynamicsNAV80 -KeyName EnableFullALFunctionTracing -KeyValue "true"
Set-NAVServerInstance DynamicsNAV80 -Restart
To create and start data collector set:
Create a COM object to create a Data Collector in Windows Performance Monitor:
$datacollectorset = New-Object -COM Pla.DataCollectorSet
$TemplateFile = 'C:\temp\NAVAppProfiler.xml'
The Template file in the line above is the one attached in this blog. Note that Dynamics NAV Server installs with a template file in “C:\Program Files\Microsoft Dynamics NAV\80\Service\DataCollectorSet.xml”. This template is designed to collect .blg files, not .etl files. Read more about performance monitoring and available counters using .blg files here:
For user activity profiling, we use .etl files (event traces). You can of course create the data collector for event trace manually, but here we will show how to automate that process, so we will use the template file attached.
 $xml = Get-Content $TemplateFile
 $DataCollectorName = 'Microsoft Dynamics NAV Server Performance Monitor'
 $datacollectorset.SetXml($xml)
 $datacollectorset.Commit("$DataCollectorName",$null, 0x0003) | Out-Null

 #After creating the data collector, it will take some seconds before it is ready to start it
 do
 {
   $datacollectorset.start($false)
   sleep(3)
   Write-Host "Starting trace ..."
 }
 while ($datacollectorset.Status -eq 0)
 $datacollectorset.Status
This will create and start a trace, listening to Dynamics NAV and collecting a .etl file to c:\PerfLogs\Admin\NAVAppProfiler.
To stop the trace:
$datacollectorset.Stop($false)
To remove the data collector set:
$datacollectorset.Delete()
You now have an .etl file ready to import into page 50000 for analysis, in folder C:\PerfLogs\Admin\NAVAppProfiler.
This file must be copied to a separate location before you can open it in a Dynamics NAV client.
Enable data collector sets in Performance Monitor using PowerShell remotely
In this case we will create and start a data collector on another machine on our domain. For more background and details about PowerShell remoting, and links to when remoting outside of your domain to the cloud, (re)visit this post:
https://blogs.msdn.microsoft.com/nav/2015/03/18/coffee-break-windows-powershell-remoting/
We will use the exact same PowerShell script as above, just with a few modifications. First, copy the template file to the remote machine:
 $RemoteMachine = "MyRemoteMachine"
 Copy-Item C:\temp\NAVAppProfiler.xml \\$RemoteMachine\c$\temp
Then create a remote session:
$RemoteSession = New-PSSession -ComputerName $RemoteMachine
Then wrap our existing code into an Invoke-session block:
  Invoke-Command $RemoteSession -ScriptBlock{
… existing script
}
No modifications needed compared to previously. So the full script should look like this:
 $RemoteMachine = "myRemoteMachine"
 Copy-Item C:\temp\NAVAppProfiler.xml \\$RemoteMachine\c$\temp

 $RemoteSession = New-PSSession -ComputerName $RemoteMachine

 Invoke-Command $RemoteSession -ScriptBlock{
 $datacollectorset = New-Object -COM Pla.DataCollectorSet
 $TemplateFile = 'C:\temp\NAVAppProfiler.xml'
 $xml = Get-Content $TemplateFile
 $DataCollectorName = 'Microsoft Dynamics NAV Server Performance Monitor'

 $datacollectorset.SetXml($xml)
 $datacollectorset.Commit("$DataCollectorName",$null, 0x0003) | Out-Null

 #After creating the data collector, it will take some seconds before it is ready to start it
 do
 {
   $datacollectorset.start($false)
   sleep(3)
   Write-Host "Starting trace ..."

 }
 while ($datacollectorset.Status -eq 0)
 $datacollectorset.Status

 }
If you remember from the previous blog post, you can use Invoke-Command either to shoot individual scripts to a remote machine, or you can create a session. If we create a session, then variables that we create remotely stay there, so in this case because we used a Session variable, then our COM instance of Performance Monitor is still available for when we want to stop it again:
 Invoke-Command $RemoteSession -ScriptBlock{

 $datacollectorset.Stop($false)
 sleep(5) #Give it time to stop before deleting it
 $datacollectorset.Delete()
 }
What’s it for?
Finally, just a short demonstration of how you can use the tool. First install the Dynamics NAV Application Profiler.
The documentation section will guide you through the simple setup process.
It is a Dynamics NAV tool, and in essence a sample of few (6) NAV objects, where user interface consists of a Dynamics NAV page, from which you can monitor one or multiple users/or server instances on the box. The scripts above have provided an option to automate that process and run it without GUI, but you can do the same profiling using GUI (NAV page) rather than data collector set. The tool looks like this:
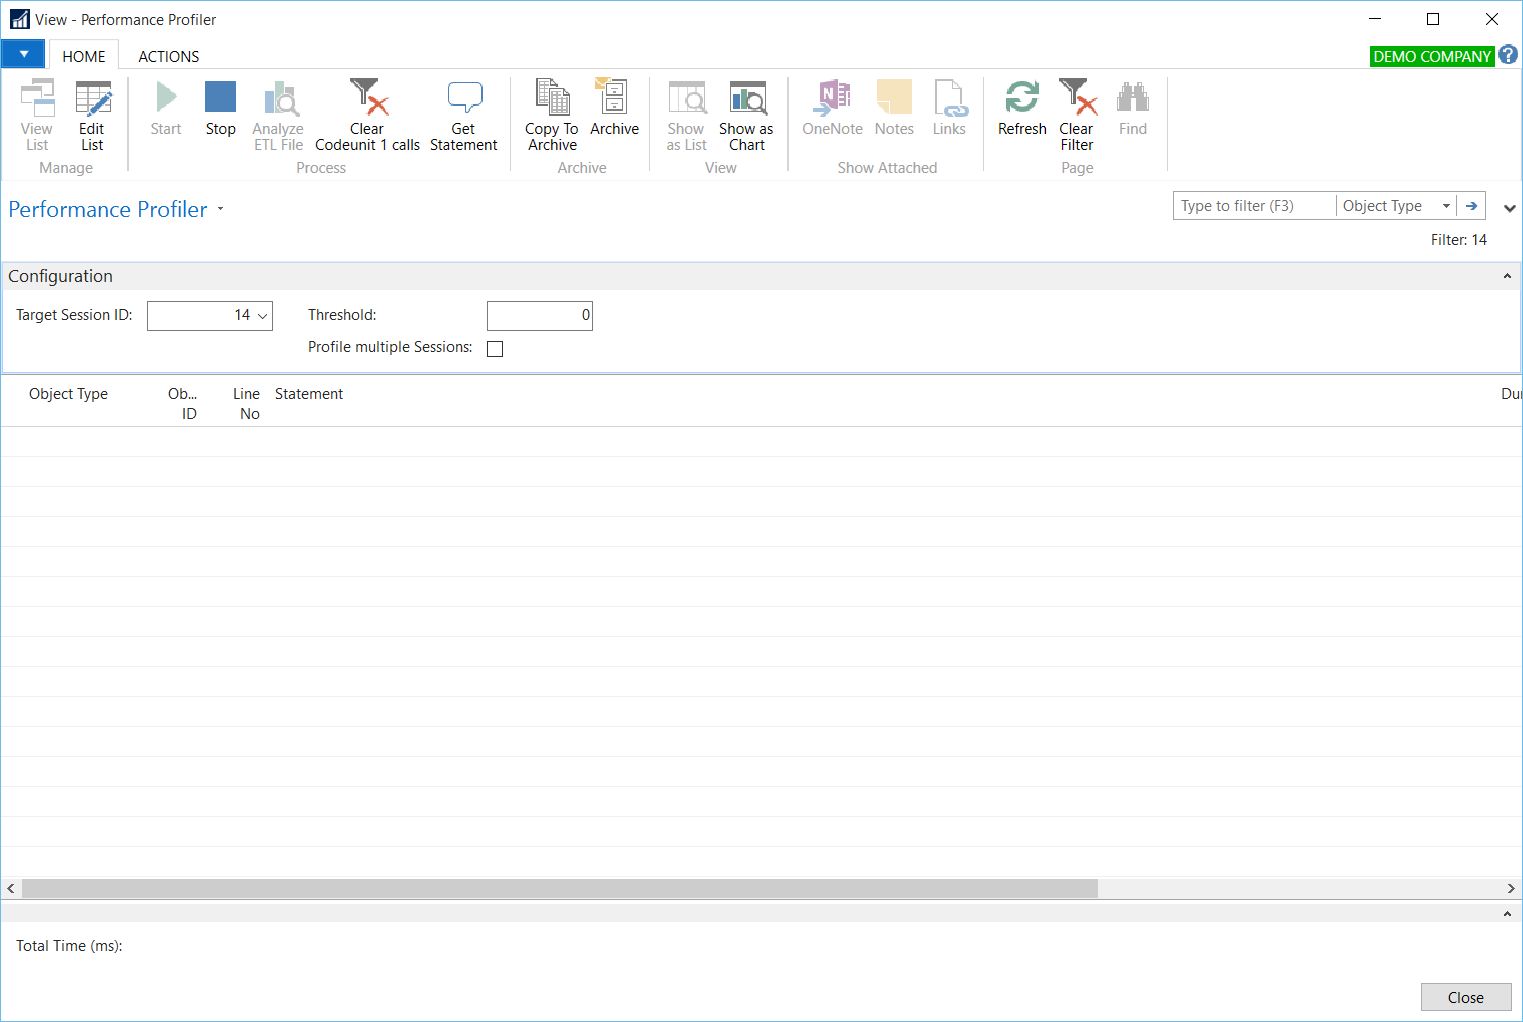
Dynamics NAV Application Profiler
And you can choose single or multiple sessions to monitor. The only thing to keep in mind is, the tool will trace all users across all Dynamics NAV Server instances on the box, if multiple sessions are selected. The session/user ID shown in the result is relative to a nst.
If you have traced user activity unattended, using data collector set, to analyze results: open the Performance Profiler page (ID 50000) and, on the Home tab, choose Analyze ETL File. The result is a list of entries, grouped per session (user ID). It will not provide more or less same capabilities as Client Monitor, with few exceptions. For examples ‘locked by’ is not present here, but it will list LastActive duration for each transaction and command, which in many cases will point to blocking source (the activity with longest LastActive value). It will also provide the application code line executed (as well as the SQL statement originating from it), and provide the Hit Count value that can be used to isolate excessive looping, or potential algorithms to improve.
Best regards
Jasminka Thunes, Escalation Engineer Dynamics NAV EMEA
Lars Lohndorf-Larsen, Escalation Engineer Dynamics NAV EMEA
Bas Graaf, Senior Software Engineer Dynamics NAV