
Example of How to use SQL Tracing Feature to Profile AL Code
Enabling Tracing in Microsoft Dynamics NAV 2013
Microsoft Dynamics NAV 2013 has a feature that allows you to see the AL call stack for a SQL commands. Here I am going to describe how it can be used to profile your application code.
There are multiple steps required to start tracing.
First, you need to start the Session List page. This is the same page that you need to open to start the debugger. So you need to start the development environment, then go to Tools, Debugger, Debug Session. You will get the Session List page.
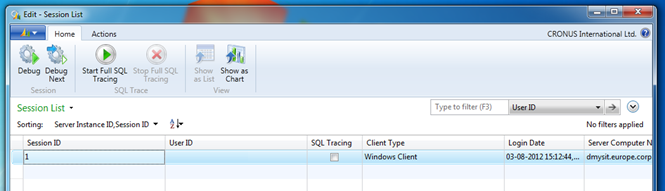
This window contains Start Full SQL Tracing/Stop Full SQL Tracing buttons. As well there is a SQL Tracing editable check box on each line.
Start Full SQL Tracing/Stop Full SQL Tracing enables/disables tracing for all new and existing sessions and the SQL Tracing check box enables/disables tracing for a given session.
Let’s assume we want to profile one of the sessions. Then we need to enable tracing for it, for example by clicking the check box.
Configuring SQL Profiler
The important part here is to select appropriate events. In this case we are interested in seeing SQL statements’ text. To achieve that we need to enable SP:StmtCompleted and SQL:BatchCompleted events. The setup should be like on the following picture.
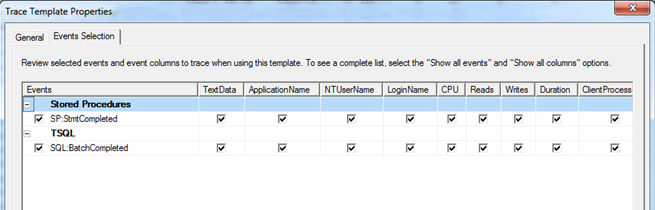
It allows seeing SQL queries for all statements issued from the AL.
After this if you do some operations in the client, for example open the Sales Orders page, you will see comments in SQL Server Profiler.
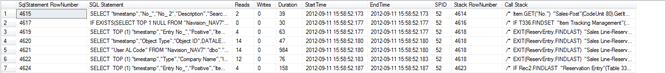
This is an example of what you can get.

All SQL statements in-between consecutive comments correspond to the AL statement from the first comment. For example in previous screenshot, CALCFIELDS issues six SQL queries.
The SQL profiler will contain Get connection from the pool and Return connection to the pool comments.

These comments correspond to the events when the connection is retrieved and returned to the Microsoft DynamicsNAV Server connection poll respectively. These comments are needed to separate SQL queries issues from different clients on the same SQL connection. The SQL statement that corresponds to these comments is issued by Microsoft Dynamics NAV Server but not originated from AL.
Comments that contain only user name also correspond to SQL statements issued by Microsoft Dynamics NAV Server but not originated from AL. For example Microsoft Dynamics NAV Server executes queries to calculate calculated fields shown on the fact boxes. We need to have this type of comments because Microsoft Dynamics NAV Server might execute an SQL query without returning connection to the pool and not originated from AL.
Filtering Your Statements
In the SQL profiler you will see statements from the different connections. This is because you can have multiple clients running or, for example, you can have SQL reporting services or some other service enabled. It is important to filter out everything except what is coming from the client you are profiling.
To do that for each SQL statement you need to find first previous comment with the same SPID. If this comment is Return connection to the pool then this SQL statement is not originated from the AL code of the client that is being profiled.
User name in the comment identifies the client by which SQL statement is generated.
Collecting the Data and Analyzing
Before the profiler is started, the server should be “warmed up,” otherwise there is going to be a lot of queries for metadata reading. The scenarios that are going to be profiled should be executed previously at least once.
After the SQL trace is collected it should be saved into the SQL table.
Bellow I have an example of an SQL script that finds the most expensive AL statements. The trace was saved into the NAV7_Trace table in the master database.
SELECT * FROM [master].[dbo].[NAV7_Trace] –query the trace table content

DECLARE @ApplicationName NVARCHAR(100)
DECLARE @GetConnection NVARCHAR(100)
DECLARE @ReturnConnection NVARCHAR(100)
DECLARE @ContainsUserName NVARCHAR(100)
DECLARE @EmptyCallStack NVARCHAR(100)
SET @ApplicationName = ‘Microsoft Dynamics NAV Service’
SET @GetConnection = ‘%Get connection%’
SET @ReturnConnection = ‘%Return connection%’
SET @ContainsUserName = ‘%User: Your user name%’
SET @EmptyCallStack = ‘/*__User: Your user name__*/’
IF OBJECT_ID(‘tempdb..#ProfilerData’) IS NOT NULL
DROP TABLE #ProfilerData
SELECT * INTO #ProfilerData FROM
(
SELECT
[RowNumber] AS [SqlStatement RowNumber],
[TextData] AS [SQL Statement],
[Reads],
[Writes],
[Duration],
[StartTime],
[EndTime],
[SPID]
FROM [master].[dbo].[NAV7_Trace]
WHERE
[ApplicationName] = @ApplicationName and
[TextData] not like @ContainsUserName and
[TextData] not like @GetConnection and
[TextData] not like @ReturnConnection and
[TextData] not like @EmptyCallStack
) SqlStatement
CROSS APPLY
(
SELECT TOP 1
[RowNumber] AS [Stack RowNumber],
[TextData] AS [Call Stack]
FROM [master].[dbo].[NAV7_Trace]
WHERE
[SPID] = SqlStatement.[SPID] and
[RowNumber] < SqlStatement.[SqlStatement RowNumber] and
[ApplicationName] = @ApplicationName and
[TextData] like @ContainsUserName
ORDER BY [RowNumber] DESC
) AS Stack
SELECT * FROM #ProfilerData –this table contains mapping of SQL statements to the AL call stack
SELECT
CAST([Call Stack] AS NVARCHAR(4000)) AS [Call Stack],
SUM(Duration) AS [Sum Duration],
AVG(Duration) AS [Average Duration],
MIN(Duration) AS [Min Duration],
MAX(Duration) AS [Max Duration],
SUM(Reads) AS [Sum Reads],
SUM(Writes) AS [Sum Writes]
FROM #ProfilerData
GROUP BY CAST([Call Stack] AS NVARCHAR(4000))
ORDER BY [Sum Duration] DESC — this query finds the most expensive AL statements

Result of previous query shows the most expensive AL calls. Second and fifth rows show the total time spent in the SQL calls issued by the server and not originated from AL.
Also you can create a query which finds SQL statements which correspond to appropriate call stacks.
SELECT * FROM #ProfilerData
WHERE [Call Stack] like ‘%”Sales-Post”(CodeUnit 80).OnRun(Trigger) line 1556%’
SELECT * FROM #ProfilerData
WHERE [Call Stack] like ‘%”Gen. Jnl.-Post Line”(CodeUnit 12).InsertGLEntry line 59%’
SELECT * FROM #ProfilerData
WHERE [Call Stack] like ‘%”Item Jnl.-Post Line”(CodeUnit 22).ApplyItemLedgEntry line 252%’
It is also easy to create a query which will count the number of times the same call stack occurs in the trace.
SELECT
COUNT(CAST([TextData] AS NVARCHAR(4000))) AS Count,
CAST([TextData] AS NVARCHAR(4000))
FROM [master].[dbo].[NAV7_Trace]
WHERE
[ApplicationName] = @ApplicationName and
[TextData] like @ContainsUserName and
[TextData] not like @GetConnection and
[TextData] not like @ReturnConnection and
[TextData] not like @EmptyCallStack
GROUP BY CAST([TextData] AS NVARCHAR(4000))
ORDER BY COUNT(CAST([TextData] AS NVARCHAR(4000))) DESC


