Simultaneous CPU/GPU Debugging in Visual Studio 2013
The debugging support introduced for C++ AMP in Visual Studio 2012 has been extended in Visual Studio 2013 when running on Windows 8.1 so that you are able to debug both the CPU and GPU parts of your C++ AMP application simultaneously. In this post I’ll show you how to get started.
1. Configure your project properties
The WARP accelerator on Windows 8.1 is the only accelerator that currently supports simultaneous debugging, so you will need to choose WARP when you want to debug your AMP code. If your application explicitly selects an accelerator then you will need to change your code to select WARP instead. If you are using the default accelerator then the C++ AMP runtime attempts to find the “best” accelerator available on your system to use as the default. Typically this will be your DirectX 11 capable GPU. But you can get the C++ AMP runtime to select WARP as the default accelerator instead via the project properties.
Take any C++ AMP project and set your properties as follows:
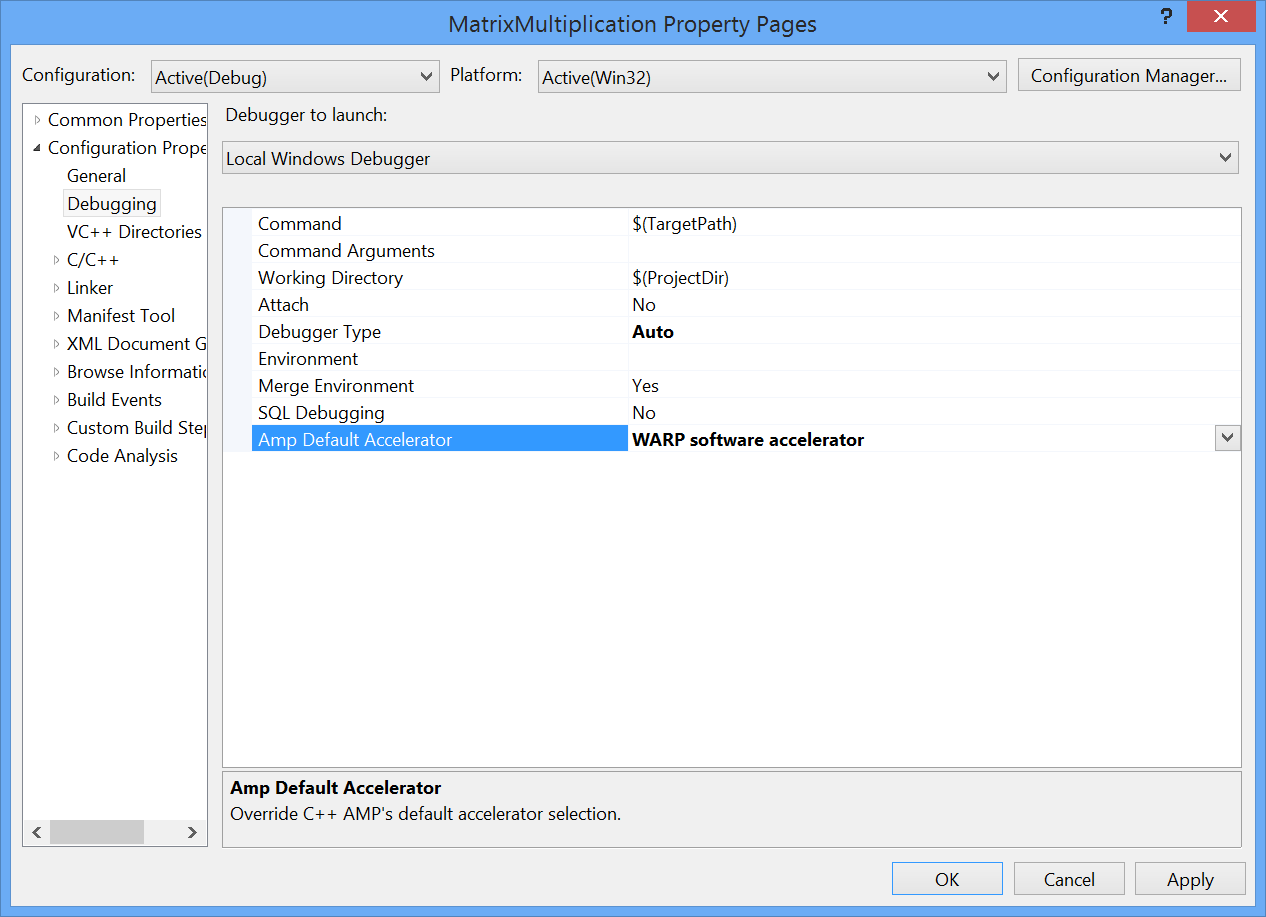
- Select Configuration Properties->Debugging
- Set “Debugger Type” to “Native Only” or “Auto”.
- Set “Amp Default Accelerator” to “WARP software accelerator”
2. Set breakpoints in your C++ AMP code
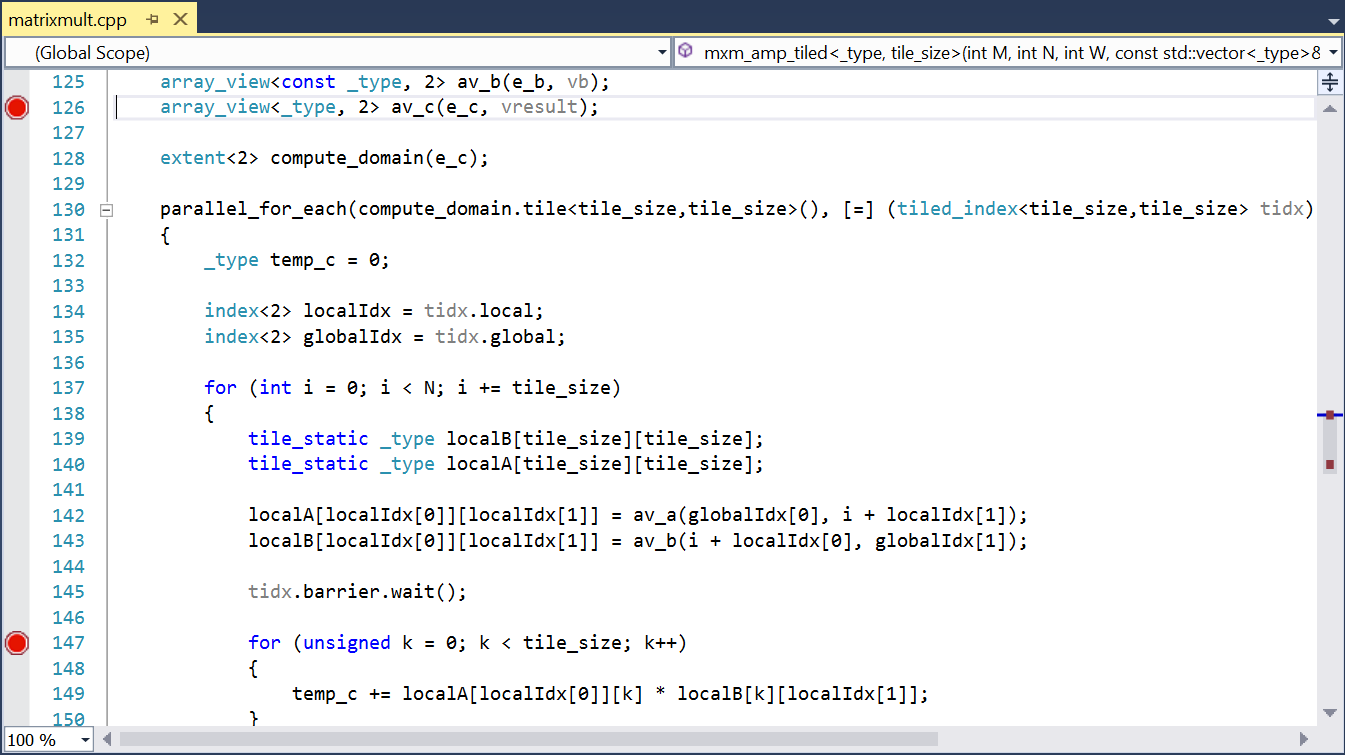
I want to demonstrate both CPU and GPU debugging capabilities so we will start by setting a couple of breakpoints, one in CPU code and another in GPU code. Set the first breakpoint somewhere in your application before the first execution of a parallel_for_each. Set the second breakpoint in the body of a parallel_for_each loop. In my MatrixMultiplication example I have set breakpoints at line 126 (CPU code) and 147 (GPU code).
3. Hit F5 to test CPU debugging
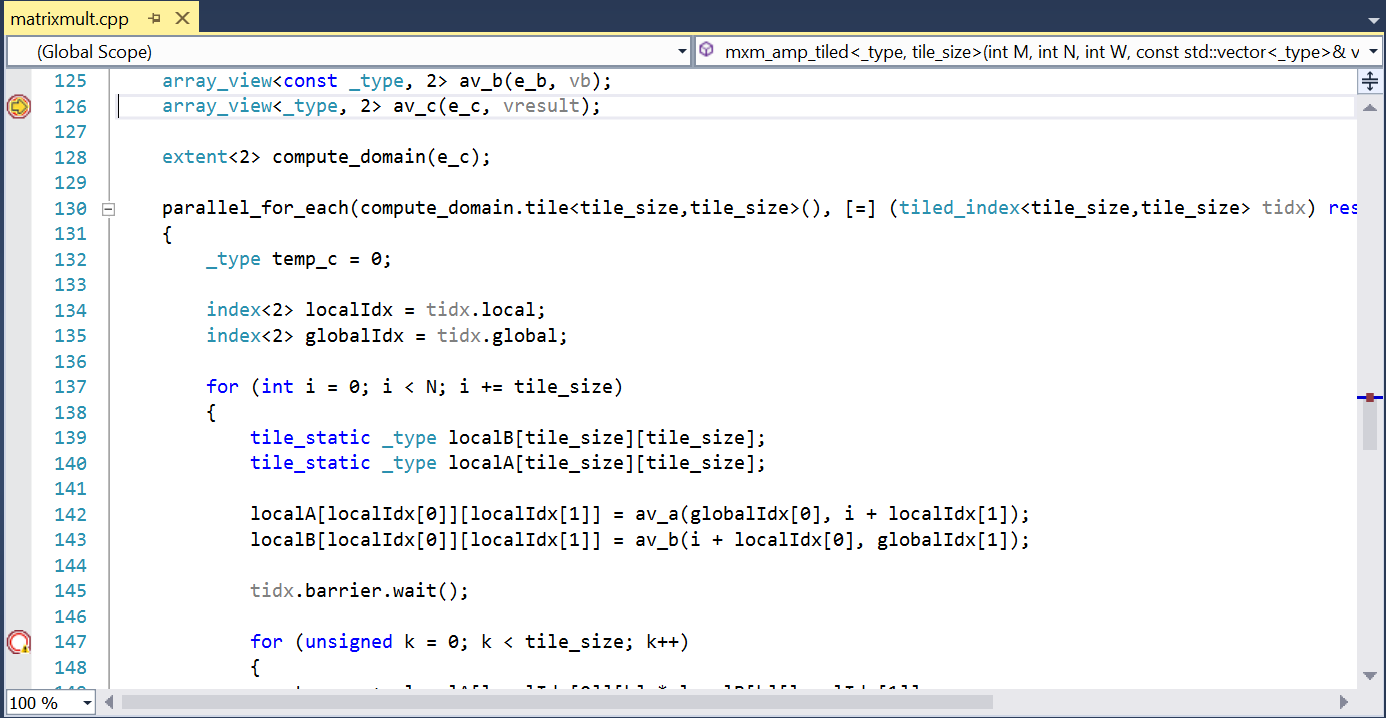
Hit the F5 key (or Debug->Start Debugging menu) to start debugging as normal. You should see your breakpoint in the CPU code get hit. All the usual CPU debugging experience is available.
The breakpoint in the GPU code (at line 147) is displayed with the unbound breakpoint icon. This is because the AMP runtime has not yet created the compute shader corresponding to the loop body. It will do so at the first attempt to execute the parallel_for_each, at which time the breakpoint will bind and the icon will become the familiar red breakpoint icon.
The execution of the body of the parallel_for_each on the GPU is asynchronous with respect to the CPU execution. If you were to advance to the parallel_for_each (line 130) and step (F10) the debugger would remain in the CPU code with the appearance of having stepped over the parallel_for_each – however the loop body will likely not yet have been executed. But since we want to debug into the GPU code we set that second break on line 147 in the loop body. When the loop body eventually gets executed the debugger will break with active GPU state available for examination.
4. Hit F5 to break in the GPU code
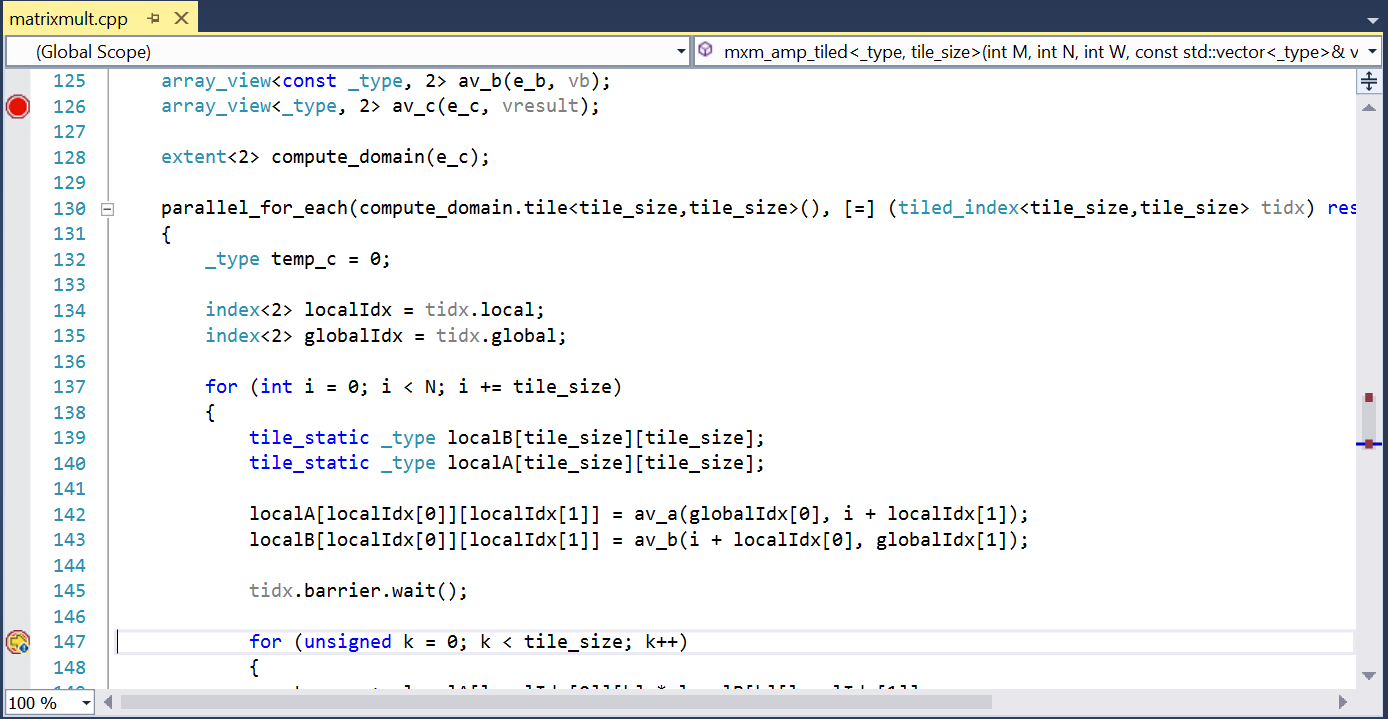
Hit the F5 key again and you will advance execution into the GPU code (line 147).
5. Debug the GPU code
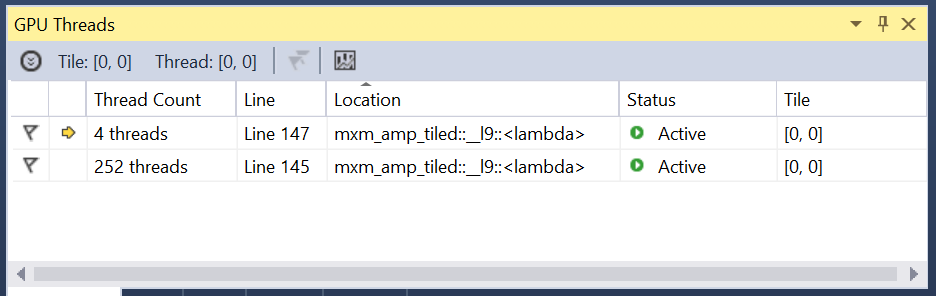
To see your GPU thread state open the GPU Threads window (Debug->Windows->GPU Threads). The entire debugger UI is directed at the GPU thread that hit the breakpoint (the current thread – in this example Tile: [0,0] Thread:[0,0]). The call stack window will show the GPU thread’s call stack, and expressions in the locals, watch, and autos windows will all be evaluated in the GPU context. The parallel watch window will allow you to evaluate expression across all active GPU threads.
6. Check the CPU state
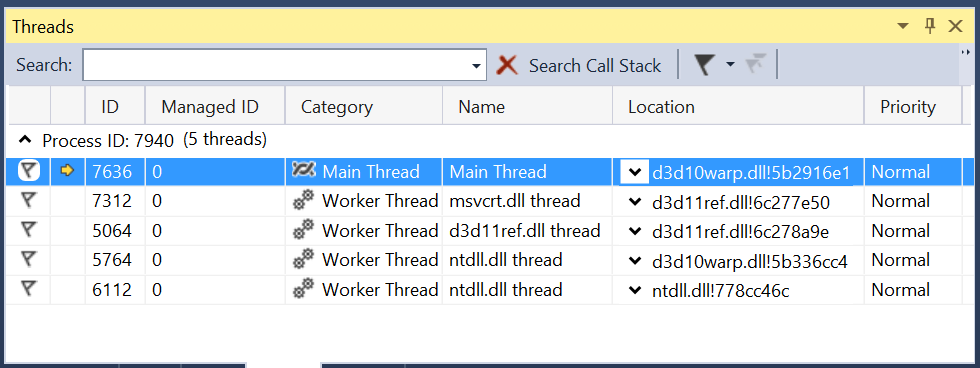
When stopped at a GPU breakpoint the CPU portion of the application is also stopped. You can easily view the CPU state without having to continue execution until you exit the GPU code. Just open the Threads window (Debug->Windows->Threads). Set your debugger context back to a CPU thread by double clicking on your main thread. The entire debugger experience is now focused on the CPU portion of your program. Once you are finished you can return to the GPU by double clicking on a line in the GPU Threads window.
Limitations
The simultaneous debugging experience is only available when your application executes on Windows 8.1 and uses the WARP software driver. WARP on earlier versions of Windows does not support debugging. Debugging GPU code on previous versions of Windows is still possible with VS 2013 using the “GPU Only” debugger type and remains unchanged from Visual Studio 2012.
When simultaneous debugging on WARP a few GPU debugging features are unavailable: race detection, freezing and thawing of GPU threads, and “Run Current Tile to Cursor”. All this functionality continues to be available when “GPU Only” debugging.
Note for Visual Studio 2013 Preview: In the preview release simultaneous debugging only works for Win32 processes, not x64 processes. 64-bit debugging will be enabled in the final product release.