Detecting Read after Write Hazards with the GPU debugger
This post assumes you have read the introduction and prerequisite: Visual Studio Race Detection for C++ AMP. I will also assume that you have enabled all the race detection options of the Exceptions dialog, as described in that prerequisite blog post. In this post, I am going to share an example that demonstrates detection of read after write hazards between threads belonging to the same tile.
A read-after-write hazard occurs when an instruction tries to read a result that has not yet been computed. Thread synchronization constructs need to be used to ensure a read instruction occurs after the write has completed.
As an example, let's look at the Matrix Multiplication sample. The original blog post explains the algorithm in detail so we don't need to repeat it here but I would like to bring your attention to the tile_barrier objects used in the tiled version of it. Let's comment out the first tidx.barrier.wait() statement on line 134 (assume we forgot to include it):
126: for (int i = 0; i < N; i += tile_size)
127: {
128: tile_static _type localB[tile_size][tile_size];
129: tile_static _type localA[tile_size][tile_size];
130:
131: localA[localIdx[0]][localIdx[1]] = av_a(globalIdx[0], i + localIdx[1]);
132: localB[localIdx[0]][localIdx[1]] = av_b(i + localIdx[0], globalIdx[1]);
133:
134: // tidx.barrier.wait();
135:
136: for (unsigned k = 0; k < tile_size; k++)
137: {
138: temp_c += localA[localIdx[0]][k] * localB[k][localIdx[1]];
139: }
140:
141: tidx.barrier.wait();
142: }
Make sure the Read-After-Write detection option under the GPU Memory Access Exceptions section in the Exceptions dialog is turned on (checked) and then start the program under the GPU debugger.The race detection tool reports a race hazard warning as follows:
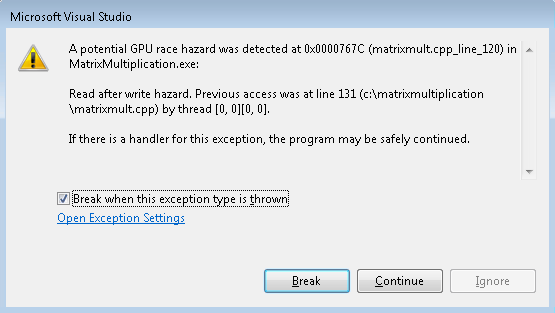
As you know by now, the warning message describes the type of race hazard that occurred (“Read after write hazard”), and includes the instruction address and the compiler generated name of the kernel. Since it takes 2 conflicting instructions to cause a race hazard, there is additional information in the warning message where we display the location of the conflicting instruction and the id of the thread that executed that conflicting instruction.
At this point you can break into the debugger to investigate the issue. When you do so, the current statement cursor will be at the source line that triggered the race hazard and the debug location toolbar will show the id of the thread that just executed that statement:
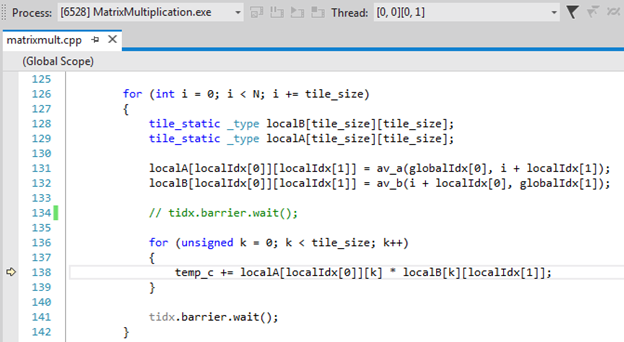
The problem in this particular case is that thread [0,0][0,0], the conflicting thread, writes to localA[0][0] at line 131 (conflicting instruction) and thread [0,0][0,1], the current thread, tries to read from it at line 138 (current instruction). Without the tile_barrier, thread [0,0][0,1] could read this memory location before thread [0,0][0,0] is able to write to it leading to a read after write (RAW) data hazard. The tile_barrier ensures localA and localB are fully written before proceeding to the next stage in the calculation.
Bonus item: If you’ve chosen to also enable “Read Uninitialized Data” checks when you run this program under the GPU debugger, and continue execution from here you’ll see an “Uninitialized Data” warning reported by the tool which is caused by the same lack of the first tile_barrier (thread[0,0][0,1] reads data that has not been initialized by thread[0,0][0,0]).