How to measure the performance of C++ AMP algorithms?
Today I am going to present a way to measure the performance of C++ AMP algorithms. Specifically I am going to show you how to accurately measure elapsed time, and what you need to know while placing the timer in your code. In the examples below I am going to use high-resolution timer for C++ that I posted earlier.
Holistic approach for time measurements
First let’s look at holistic approach of measuring the elapsed time, I took a simple matrix multiplication and placed the timer around the C++ AMP code.
Listing of example1.cpp:
  1: #include <amp.h>
  2: #include <vector>
  3: #include <random>
  4: #include <iostream>
  5: #include <iomanip>
  6: #include "timer.h"
  7:
  8: using namespace concurrency;
  9: using std::vector;
  10:
  11: void Fill(vector<float> &v,
  12:           float min = -1 << 15,
  13:           float max = 1 << 15)
  14: {
  15:     static std::mt19937 mersenne_twister_engine;
  16:     std::uniform_real_distribution<float> uni(min, max);
  17:
  18:     for(size_t i = 0; i < v.size(); ++i)
  19:     {
  20:         v[i] = uni(mersenne_twister_engine);
  21:     }
  22: }
  23:
  24: void ComputeMatrixMult(array<float, 2> &mC,
  25:                        array<float, 2> &mA,
  26:                        array<float, 2> &mB)
  27: {
  28:     parallel_for_each(mC.extent,
  29:                       [&](index<2> idx) restrict(amp) {
  30:
  31:         float result = 0.0f;
  32:         for(int i=0; i<mA.extent[1]; ++i)
  33:         {
  34:             index<2> idxA(idx[0], i);
  35:             index<2> idxB(i, idx[1]);
  36:
  37:             result += mA[idxA] * mB[idxB];
  38:         }
  39:
  40:         mC[idx] = result;
  41:     });
  42: }
  43:
  44: void main()
  45: {
  46:     for (int input=0; input<10; ++input)
  47:     {
  48:         const int M = 300 + 100 * input;
  49:         const int N = 500 + 100 * input;
  50:         const int W = 400 + 100 * input;
  51:
  52:         vector<float> vA(M * N);
  53:         vector<float> vB(N * W);
  54:         vector<float> vC(M * W);
  55:         Fill(vA);
  56:         Fill(vB);
  57:
  58:         Timer tAll;
  59:         tAll.Start();
  60:
  61:         extent<2> eA(M, N), eB(N, W), eC(M, W);
  62:         array<float, 2> mA(eA), mB(eB), mC(eC);
  63:
  64:         copy(vA.begin(), mA);
  65:         copy(vB.begin(), mB);
  66:         ComputeMatrixMult(mC, mA, mB);
  67:         copy(mC, vC.begin());
  68:         tAll.Stop();
  69:
  70:         std::cout << std::fixed << std::setprecision(2)
  71:                   << tAll.Elapsed() << " ms" << std::endl;
  72:     }
  73: }
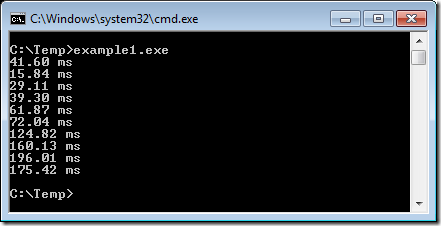
When I compile and execute above code on my machine with AMD5870, I got following results:
What I would expect is that time would increase as I increase problem size, but as you can see it is not the case. My first time measurement is 42ms, while next one with larger matrices was computed in 16ms, and then the time taken increases as we process larger data. There are 2 reasons that the first run takes longer than expected:
1) The C++ AMP runtime uses a lazy initialization pattern, meaning that it is initialized at first use. In our example above, it happens at the construction of ‘mA’ array. During that time the C++ AMP runtime would enumerate all available devices on my machine, pick the default accelerator, then it would create your array object and return.
2) Just-in-time (JIT) overhead at first run. Every parallel_for_each is compiled to Direct3d shader bytecode and stored in your binary. When the program runs and invokes parallel_for_each for the first time the bytecode for that parallel_for_each is just-in-time compiled to target assembly by GPU driver and cached for future use.
Both (1) and (2) are unavoidable, and when you measure the performance of your program you want to get these out of the picture. To exclude the C++ AMP runtime initialization you can call tAll.Start() after creation of the array, right before copy-in operation or you can query for available GPU devices at the start of the program, simply make the first use before starting the timer. To force JIT to happen we actually need to run the parallel_for_each. The good thing is that data size does not matter, so if your algorithm is flexible you can perform “warm up” on very small dataset. In the next section I will show how you can perform this warm-up operation plus more.
Kernel execution time vs memory copy operations
In this section I will apply what we have learned in section above and further change our example to break down kernel execution and copy operations into separate time measurements. Measuring copy operations separately from kernel execution has few benefits, mainly you have a more detailed view of where the time is spent, but also you would be able to calculate speedup. Let’s say I change my matrix multiplication algorithm from using the simple model of C++ AMP to using the tiled model, and then I would like to calculate the how many times my new algorithm is faster than the previous version (speedup). To do that I would take only kernel execution time and divide the elapsed time of the simple matrix multiplication by the elapsed time of the tiled matrix multiplication. I would not include copy times, because the problem size has not changed and it might cloud my speedup if the copy times contribute significantly to the entire execution time.
Partial listing of example2.cpp:
    1: void WarmUp()
    2: {
    3:     extent<2> eA(1, 1), eB(1, 1), eC(1, 1);
    4:     array<float, 2> mA(eA), mB(eB), mC(eC);
    5:     ComputeMatrixMult(mC, mA, mB);
    6: }
    7:
    8: void main()
    9: {
   10:     WarmUp(); // warm up runtime and JIT our kernel
   11:
   12:     for (int input=0; input<10; ++input)
   13:     {
   14:         const int M = 300 + 100 * input;
   15:         const int N = 500 + 100 * input;
   16:         const int W = 400 + 100 * input;
   17:
   18:         vector<float> vA(M * N);
   19:         vector<float> vB(N * W);
   20:         vector<float> vC(M * W);
   21:         Fill(vA);
   22:         Fill(vB);
   23:
   24:         Timer tAll, tCopyIn, tCompute, tCopyOut;
   25:         tAll.Start();
   26:
   27:         extent<2> eA(M, N), eB(N, W), eC(M, W);
   28:         array<float, 2> mA(eA), mB(eB), mC(eC);
   29:
   30:         tCopyIn.Start();
   31:         copy(vA.begin(), mA);
   32:         copy(vB.begin(), mB);
   33:         tCopyIn.Stop();
   34:
   35:         tCompute.Start();
   36:         ComputeMatrixMult(mC, mA, mB);
   37:         mC.accelerator_view.wait();
   38:         tCompute.Stop();
   39:
   40:         tCopyOut.Start();
   41:         copy(mC, vC.begin());
   42:         tCopyOut.Stop();
   43:
   44:         tAll.Stop();
   45:
   46:         std::cout <<  std::fixed << std::setprecision(2)
   47:             << "copy-in=" << tCopyIn.Elapsed() << " ms, "
   48:             << "compute=" << tCompute.Elapsed() << " ms, "
   49:             << "copy-out=" << tCopyOut.Elapsed() << " ms, "
   50:             << "total=" << tAll.Elapsed() << " ms" << std::endl;
   51:     }
   52: }
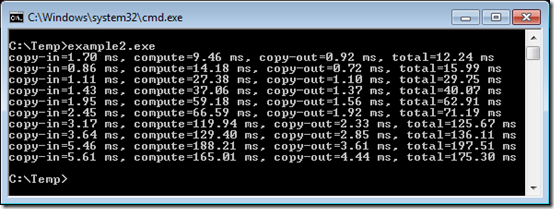
Now when I compile and execute our example, I get following results:
Besides our new WarmUp function, I added a call to accelerator_view::wait(). This call is required if you want to measure the time of the computation itself, because parallel_for_each is an asynchronous call (even though it acts as if synchronous in terms of observable results). When parallel_for_each returns, then computation is only scheduled on the device. To force execution you need to call wait() on accelerator_view. Because copying-out results blocks until the kernel execution completes, the call to wait() was not necessary in the previous example/section, where we measured elapsed time of entire C++ AMP program.
Note that if you have two parallel_for_each calls and you would like to measure the elapsed time for the second call, then you would have to call accelerator_view::wait() before and after the second parallel_for_each. Call to accelerator_view::wait() blocks until all previously scheduled asynchronous operations have completed. Failure to do so would potentially include execution of first parallel_for_each in your measurement. This rule applies to any two consecutive asynchronous calls. Another example would be asynchronous copy-in, followed by the parallel_for_each. In this situation you would have to call accelerator_view::wait() or wait() on std::shared_future returned from asynchronous copy-in operation before the call to parallel_for_each, followed by accelerator_view::wait() after the call.
Consideration for array_view
If I had used an array_view type, instead of an array in my simple matrix multiplication then I would not be able to measure the elapsed time for copy-in operation separately from kernel execution. There would be no explicit copy-in operation. The data wrapped by the array_view is copied implicitly right before the kernel execution. Copy-out can be measured by timing array_view::synchronize() function, or by timing the first access to the data, e.g. via the array_view::operator[]
For the reasons mentioned above when dealing with array_view I would recommend measuring the performance of kernel together with copy operations as shown in the holistic approach paragraph. Please remember that you still need to create a WarmUp function to eliminate C++ AMP runtime initialization and JIT overhead from affecting your first measurement.
Conclusions
Time measurement is a crucial metric while working with C++ AMP. Ultimately after changing your sequential or multicore CPU algorithm to take advantage of accelerators like the GPU, you need to make sure that your new algorithm performs better than the previous approach.
Remember about following gotchas:
- Perform C++ AMP runtime initialization before you start measuring the performance.
- Avoid JIT overhead by running your algorithm with small dataset (warm up).
- parallel_for_each is asynchronous call, you need to call wait on accelerator_view if you plan to measure the performance of kernel execution.
Despite the fact that we use high-resolution timer, there are going to be some variations in results caused by OS interference. It is therefore good idea to repeat your measurements multiple times and keep an eye on standard deviation. Additionally please remember to always use “Release” configuration when building your project for performance measurements.
One of the disadvantages of measuring elapsed time is that you do not know whether you can do any better. How do you know that you are taking full advantage of your GPU hardware? Calculating floating-point operations per second (FLOPS) can answer that question, but that is the topic for another day.
![]()

