How to: Configure client-side tracing for Azure cache applications, view traces
To troubleshoot Azure cache related problems, it is often required to capture client side traces for Azure cache applications. While there are articles that talks about Client-side tracing, I did not come across one article that has step by step article to configure client side tracing and view the traces. Hence, I’m posting step by step instructions to configure client side tracing for Azure cache applications in this blog entry.
Below are the key steps to successfully capture, view client side traces.
· Configure Application’s Web.Config to allow client side cache libraries to emit traces.
· Configure Diagnostics for the Web/Worker role that is using Azure Cache
· View the traces via WADLogsTable located in Windows Azure Storage
For the sake of this example, I’m summarizing the steps to configure client side tracing for Web role that is using Azure Cache.
1) Add below configuration @ configuration/dataCacheClients
<tracing sinkType="DiagnosticSink" traceLevel="Verbose" />
Note: <!--traceLevel can have the following values : Verbose, Info, Warning, Error or Off-->
After adding the above configuration element to web.config , dataCacheCLients configuration should look like below.
<dataCacheClients>
<tracing sinkType="DiagnosticSink" traceLevel="Verbose" />
<dataCacheClient name="default">
<hosts>
<host name="mycache.cache.windows.net" cachePort="22233" />
</hosts>
<securityProperties mode="Message">
<messageSecurity
authorizationInfo="xxxxxxxxxxxxxxxxxxxxxxxxxxxxxxxxxxxxxxxxxxxxxxxxxxxxxxxxxxx">
</messageSecurity>
</securityProperties>
</dataCacheClient>
</dataCacheClients>
2) Navigate to properties of Web role, Under “Configuration” Tab, Select “Enable Diagnostics” under Diagnostics section.
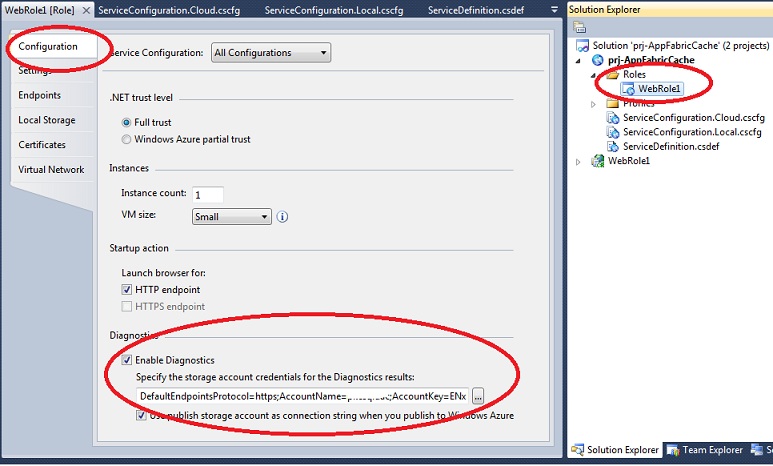
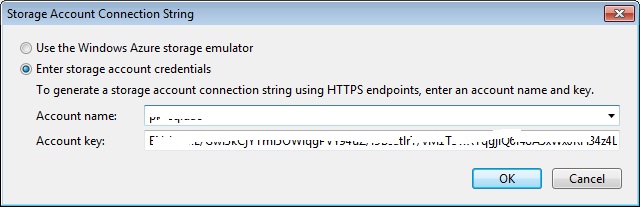
3) Configure Storage Account Connection String by clicking ellipsis button available Diagnostics section, specify cloud storage account details
4) Under OnStart() Method In WebRole.cs, add the following code before return statement to schedule logs transfer to cloud storage account.
//Get default configuration of DiagnosticsMonitor
var config = DiagnosticMonitor.GetDefaultInitialConfiguration();
//Configure what level of logging should be transferred to storage
config.Logs.ScheduledTransferLogLevelFilter = LogLevel.Verbose;
//Configure the interval for transferring the logs to storage
config.Logs.ScheduledTransferPeriod = System.TimeSpan.FromMinutes(1.0);
//Start the DiagnosticMonitor with new configuration
DiagnosticMonitor.Start("Microsoft.WindowsAzure.Plugins.Diagnostics.ConnectionString", config);
5) Run the application and reproduce the issue or start adding/removing cache items.
6) To view the client side traces, use any storage explorers and look into WADLogsTable table under your storage account
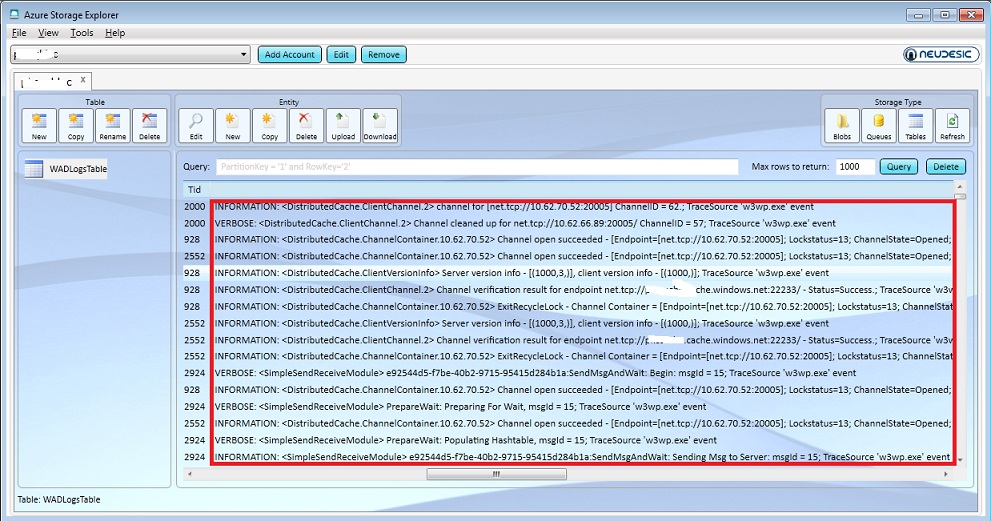
Above screenshot is taken when using Azure Storage Explorer. Below blog post has references to several other storage explorers
https://blogs.msdn.com/b/windowsazurestorage/archive/2010/04/17/windows-azure-storage-explorers.aspx
References
Below blog entry has useful information on how to configure client side tracing programmatically and how to see the logs in Compute Emulator UI when testing the application from Compute Emulator.
https://blogs.msdn.com/b/windowsazure/archive/2011/06/29/client-side-tracing-for-windows-azure-appfabric-caching.aspx
Client-side Tracing and Request Tracking in Windows Azure Caching
https://msdn.microsoft.com/en-us/library/windowsazure/gg618006.aspx