Troubleshoot Network Security Groups (NSGs) In Microsoft Azure With Network Watcher
Editor's note: The following post was written by Cloud and Datacenter Management MVP Timothy Warner as part of our Technical Tuesday series. Albert Duan of the MVP Award Blog Technical Committee served as the technical reviewer for this piece.
As you most likely already know, Network Security Groups (NSGs) represent your first line of defense in controlling ingress and egress traffic with your virtual networks (VNets) in Microsoft Azure.
As a general best practice, I suggest you bind NSGs to subnets rather than to individual virtual network interface cards (vNICs) to reduce complexity and troubleshooting effort. Nevertheless, you will certainly have the need to "sanity check" your Azure VM access to make sure you're allowing the traffic you need, and blocking everything else.
Let's learn how to enable and use Network Watcher, an Azure toolset designed to make working with NSGs easier and, dare I say it, fun!
Enable Network Watcher
Our first order of business is to enable Network Watcher on the Azure regions associated with your VNets. In the Azure portal, open the Network Watcher blade, filter the subscriptions and regions list to locate your home regions, and enable the service as shown in Figure 1.
[caption id="attachment_29505" align="alignnone" width="900"]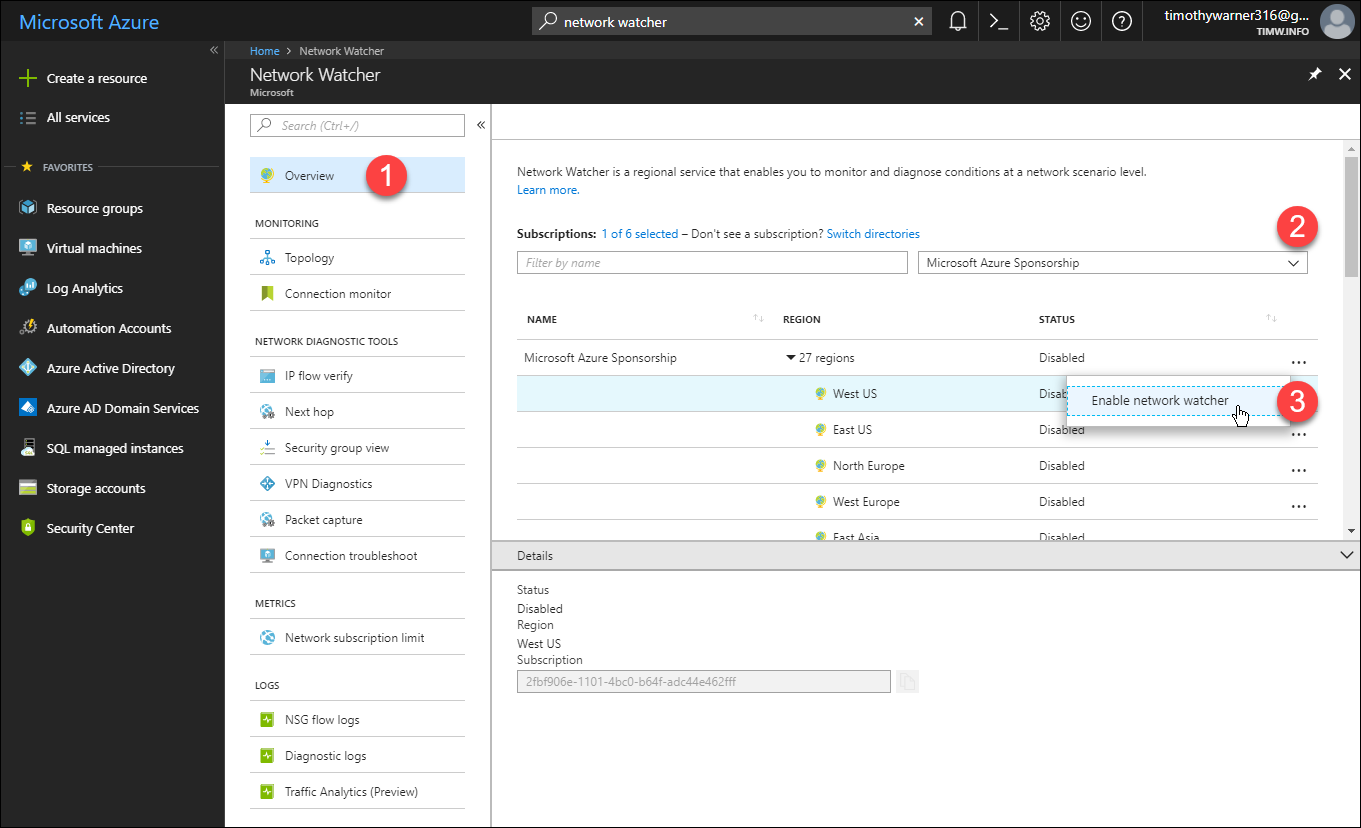 Figure 1. Enabling Network Watcher for selected Azure regions[/caption]
NOTE: You are not charged for the number of regions in which you enable Network Watcher. Instead, you are charged if you exceed the Free tier thresholds for number of checks and size of collected network logs. See the Network Watcher pricing page for more details.
Cool! Now that we've enabled Network Watcher, it's time to investigate what it can offer. We'll start with Security group view.
Security group view
Have you used the NTFS effective permissions tool in Windows? Or the Resultant Set of Policy (RSoP) toolset in Group Policy? Well, that's what Network Watcher security group view reminds me of.
In Network Watcher settings, browse to Network Diagnostic Tools > Security group view. Set the drop-down filters for the appropriate subscription, resource group, VM, and vNIC and you'll see a four-tab report of effective NSG rules. They are as follows, and shown in Figure 2:
- Effective: The blended sum total inbound and outbound NSG rules affecting the VM
- Subnet: NSG rules linked at the subnet scope
- Network interface: NSG rules linked at the vNIC scope
- Default: NSG default inbound and outbound rules
[caption id="attachment_29525" align="alignnone" width="900"]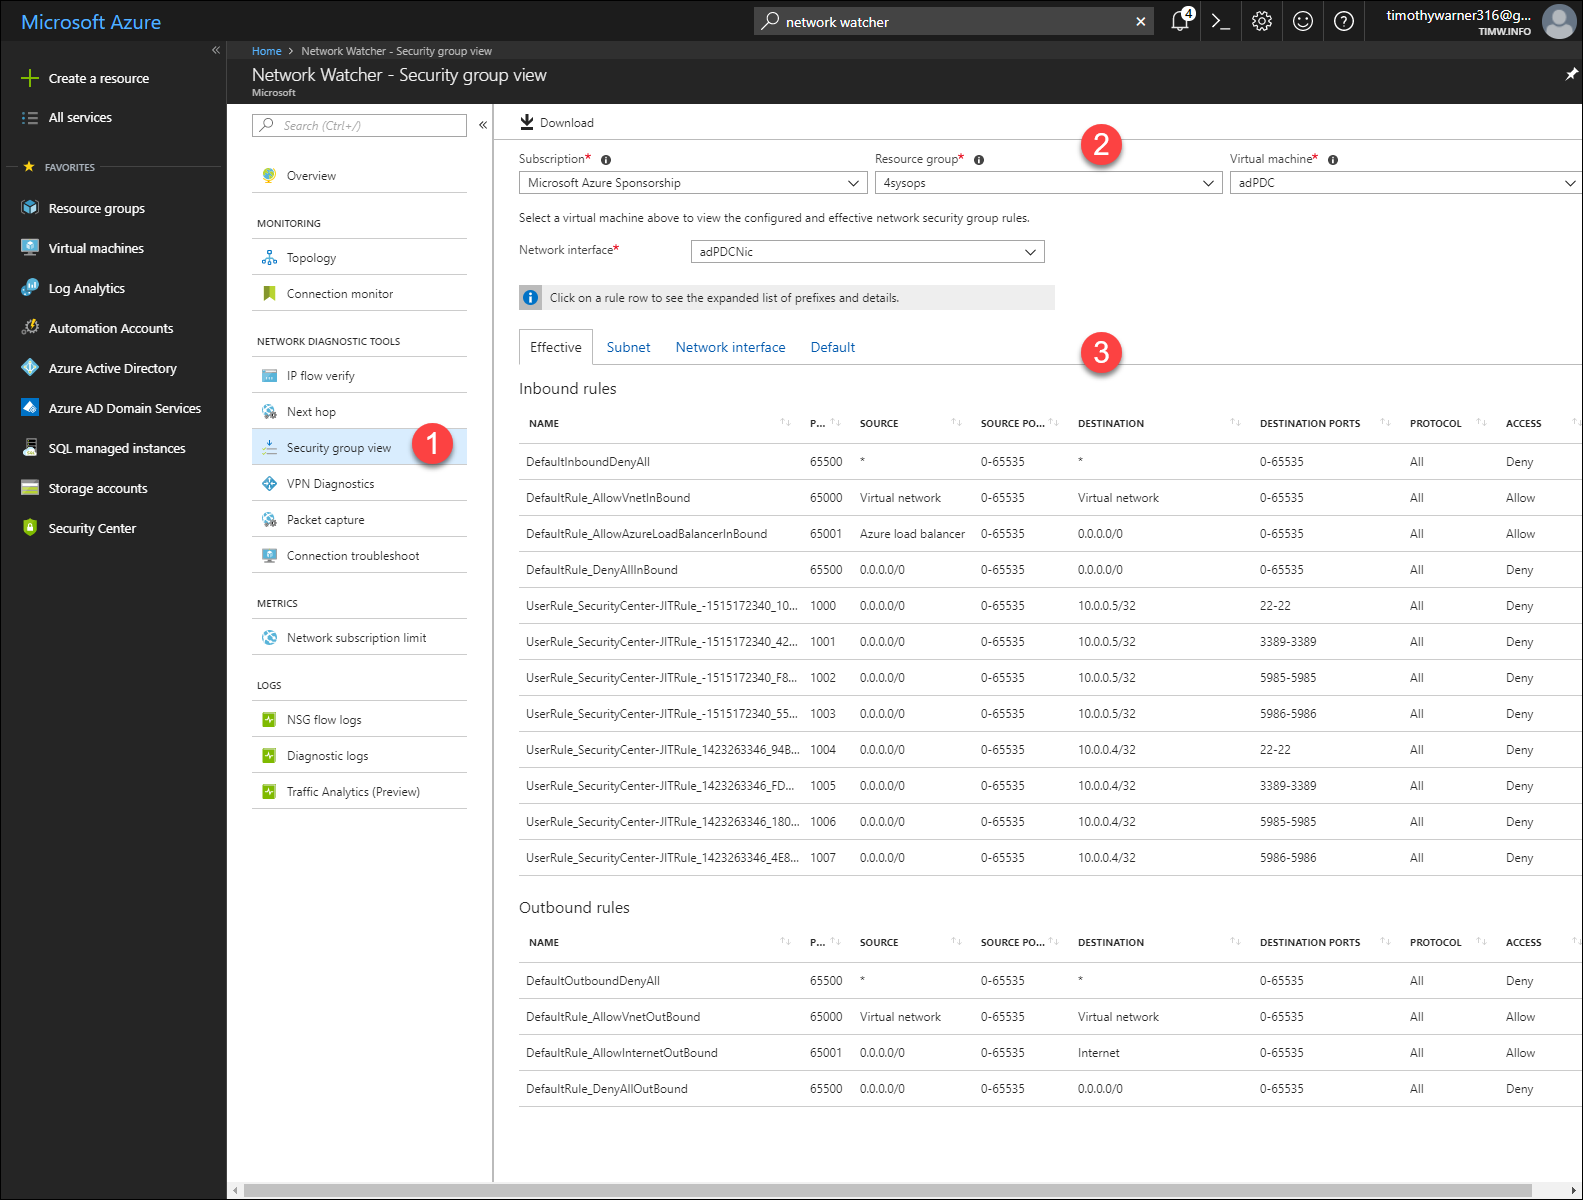 Figure 2. Security group view[/caption]
NOTE: Click Download to grab a comma-separated value (.csv) version of these rules tables.
In sum, security group view is great both for reporting on NSG rules, as well as getting a "big picture" as to how you are shaping traffic to and from a particular VM.
To perform more fine-tuned troubleshooting, we will examine IP flow verify next.
IP flow verify
In Network Watcher, navigate to Network Diagnostic tools > IP flow verify and think about what kind of connection you need to model. How about testing inbound connection on TCP 3389, the default Remote Desktop Protocol (RDP) port?
As I show in Figure 3, start by selecting the appropriate subscription, resource group, VM, and network interface.
Next, select protocol, direction (inbound to the VM or outbound from it), local IP address and remote IP address. The local IP address is always the IPv4 address of your VM, by the way. Click Check to run the test.
[caption id="attachment_29535" align="alignnone" width="900"]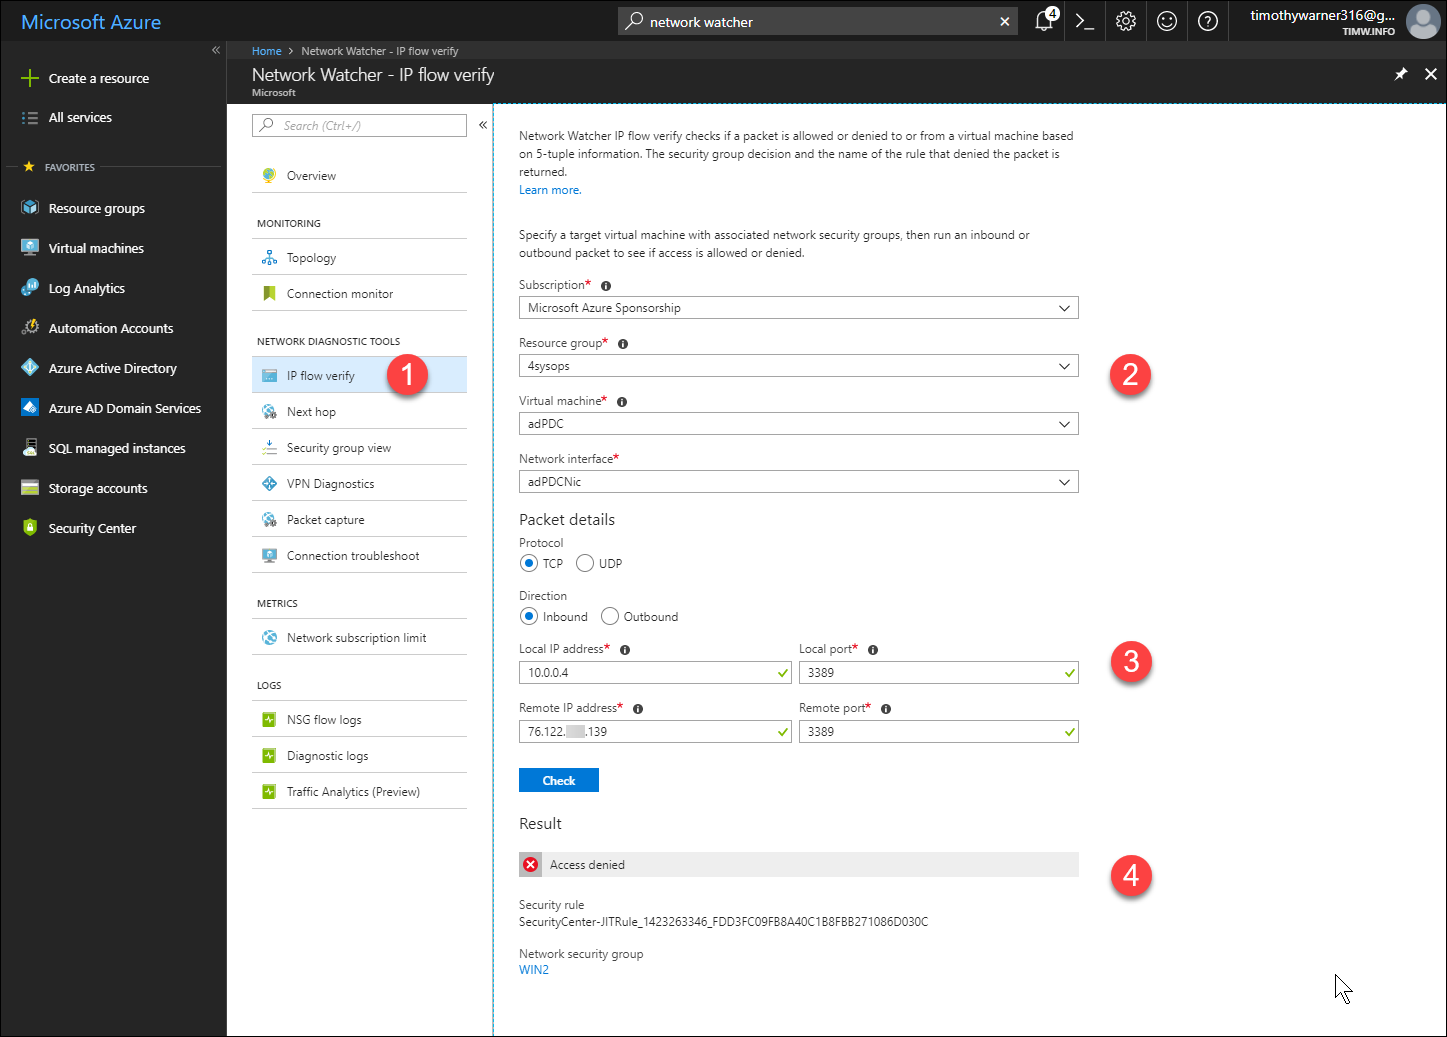 Figure 3. IP flow verify[/caption]
Notice that the Result field reports precisely which NSG and rule are responsible for blocking the connection, if it is blocked.
Logs and traffic analytics
We systems administrators reflexively look for log files when troubleshooting resource, am I right?
Let's enable NSG flow logs, which are JavaScript Object Notation (JSON) log files that record all ingress and egress traffic on your NSGs. In Network Watcher, browser to Logs > NSG flow logs, select an NSG, complete the Flow logs settings form
[caption id="attachment_29545" align="alignnone" width="900"]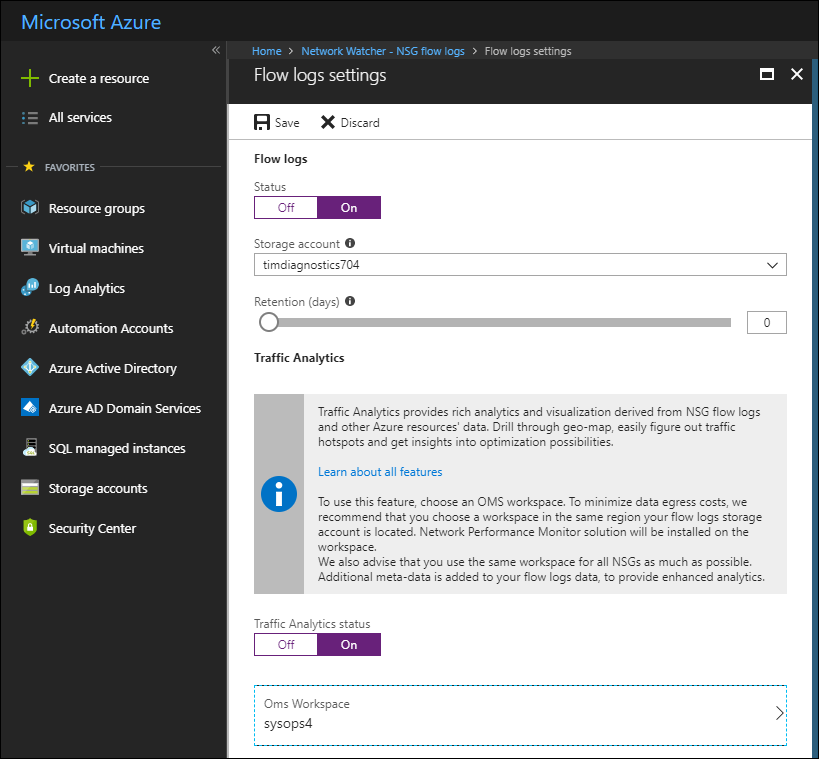 Figure 4. Enabling NSG flow logs and Traffic Analytics[/caption]
Notice that NSG flow logs are stored in an Azure storage account. If you are already taking advantage of Azure Log Analytics (and I sincerely hope you are), then you should also enable Traffic Analytics and point Network Watcher to your Log Analytics workspace.
Here's the deal: the flow logs provide raw data, and you can access them by using Azure Storage Explorer or Azure PowerShell. In Figure 5 I show you how I used Azure Storage Explorer to browse into the blob service of my diagnostics storage account and opened my most recent flow log in Visual Studio code:
[caption id="attachment_29555" align="alignnone" width="900"]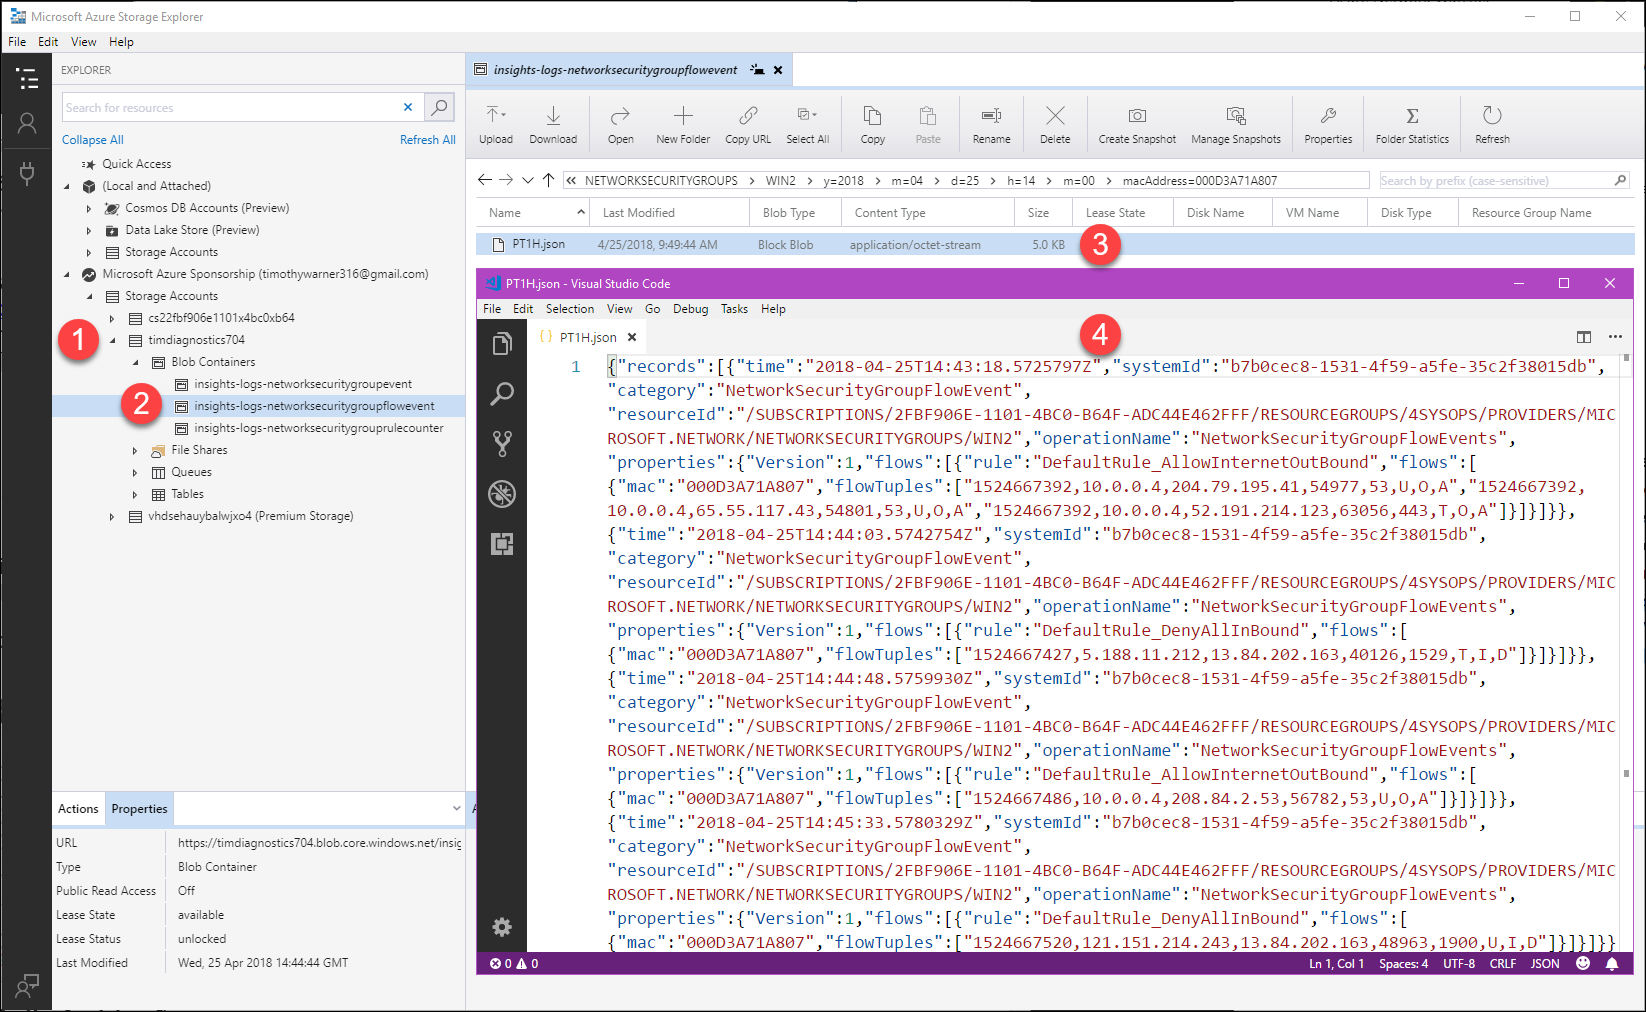 Figure 5. Viewing NSG flow logs[/caption]
Traffic Analytics performs deep processing on your NSG behavior and presents the flow data as a graphical dashboard.
Because Microsoft has much more interesting output, I borrowed one of their images for Figure 6:
[caption id="attachment_29565" align="alignnone" width="900"]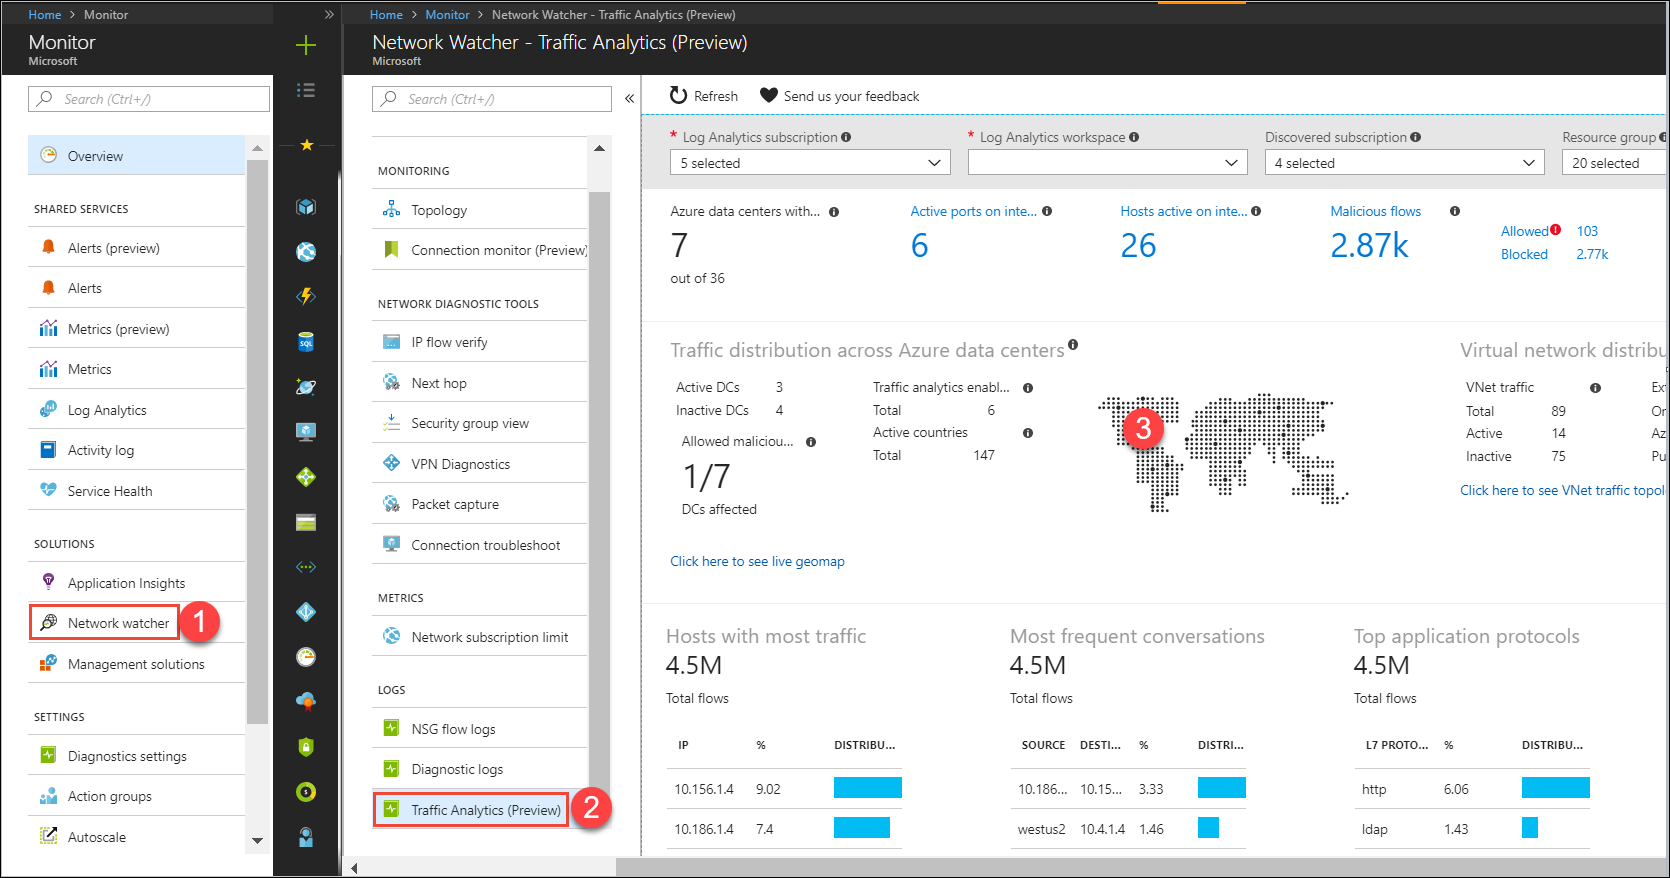 Figure 6. NSG Traffic Analytics[/caption]
NOTE: Traffic Analytics is in public preview as of this writing in May 2018. Be aware that preview features have a different service-level agreement (SLA) than do generally available features.
Next steps
Although we don't have the scope to go further, let me briefly explain some of the other nifty Network Watcher tools:
- Topology: Generate an interactive VNet topology diagram and download the .svg for ingestion into Microsoft Visio
- Connection monitor: Monitor ongoing connectivity between two VMs in Azure
- Next hop: Trace the routing path between two VMs in Azure
- Packet capture: Generate a network packet trace and then import into Microsoft Message Analyzer or Wireshark for analysis
I hope you feel better equipped to troubleshoot network security groups effectively. Take good care!
 Timothy Warner is a Microsoft Most Valuable Professional (MVP) in Cloud and Datacenter Management who is based in Nashville, TN. His professional specialties include Microsoft Azure, cross-platform PowerShell, and all things Windows Server-related. You can reach Tim via Twitter @TechTrainerTim, LinkedIn or his personal website, techtrainertim.com.