Secure an Asp.Net MVC multi-tenant Power BI Embedded hosted in an Azure Web App
Editor's note: The following post was written by Microsoft Azure MVP Frank Boucher as part of our Technical Tuesday series. James Chambers of the MVP Award Blog Technical Committee served as the editor for this piece.
Power BI gives us the possibility to create amazing reports. Even if it’s great to be able to share those reports from the very secure Power BI portal, sometimes we need to share them inside other applications or websites. Once again, Power BI doesn’t disappoint us - it provides Power BI Embedded. In this post, I will explain how to use Power BI Embedded and make it secure so each tenant can view their data.
The Problem
Despite online information that explains how to use filters to change what’s visible in our reports, filters can easily be changed by the user. Even if you hide the filter panel, those settings could easily be modified using JavaScript… Therefore, it’s definitely not the best way to secure private information.
The Solution
In this post, I will be using roles to limit the access of data. The well-known database, Adventure Works, will be used to demonstrate how to partition the data. In this case, we’ll be using the customer table.
In Azure
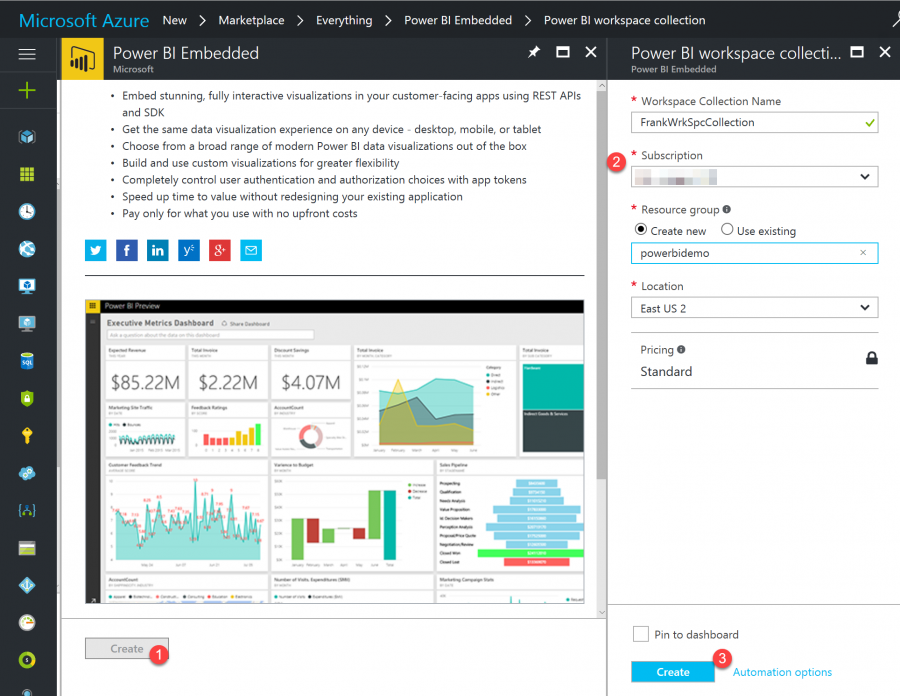
Open the Azure portal to create a Power BI Embedded component. Of course, in a real project, it would be better to create it in an Azure Resource Management (ARM) template - but to keep this post simple we will create it with the portal. Click on the big green “+” at the top left corner. In the search box type Powerbi, and hit Enter. Select Power BI Embedded in the list and click the Create button. Once it’s created, go to the Access Keys property of the brand-new Power BI Workspace Collection and take note of the Key. We will need that key later to upload our Power BI report.
For this demo, the data source will be Adventure Works in an Azure Database. Simply click the “+” button again and select Database. Be sure to select Adventure Works as the source to reproduce this demo. 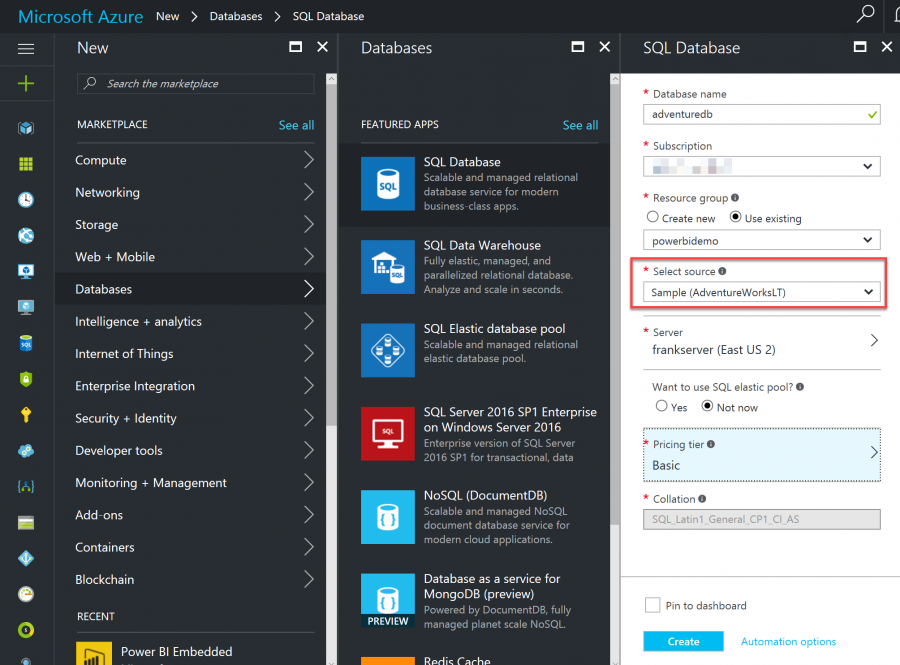
In Power BI Desktop
Power BI Desktop is a free tool from Microsoft that will help us to create our report; it can be downloaded here.
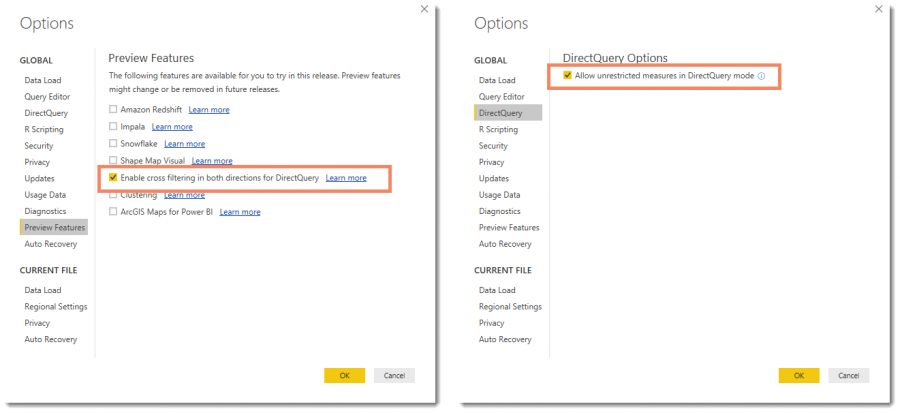
Before we get started, two options need to be modified. Go in the File menu and select Options and Settings, then Options. The first one is in the section titled Preview Features; check the option: Enable cross filtering in both directions for DirectQuery. The second is in the section is DirectQuery, check the option Allow unrestricted measures in DirectQuery mode. It’s a good idea to restart Power BI Desktop before continuing.
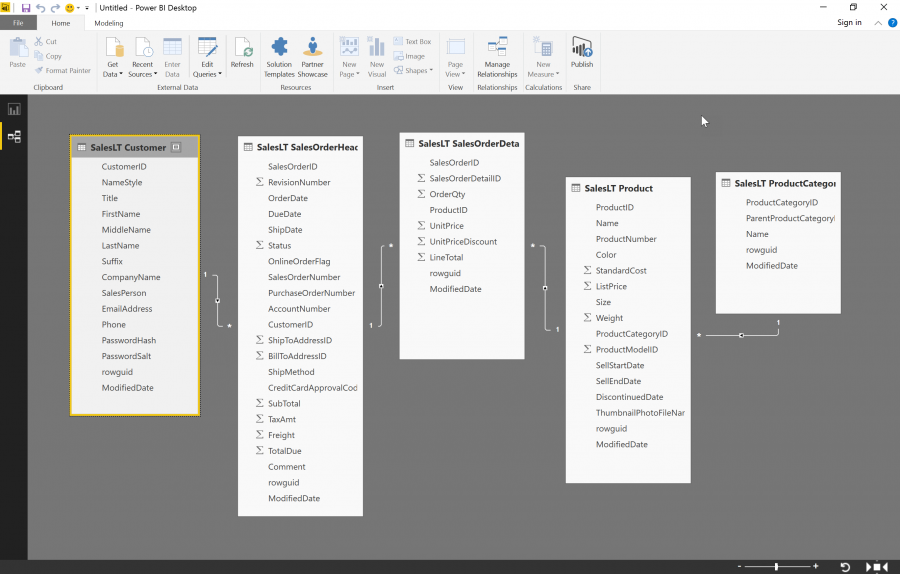
To create our reports, we first need to connect to our datasource. In this case, our Azure Database. Click the Get Data button, then Azure, and Microsoft Azure SQL Database. It’s important to be attentive to the type of connection - Import or Direct Query - because you won’t be able to change it after. You will need to rebuild your report from scratch. For this case select Direct Query.
This chart will be displaying information about invoice detail. Be sure to include the table that will be used for your role. In this case, I will be using Customer. Each customer must see only their invoices.
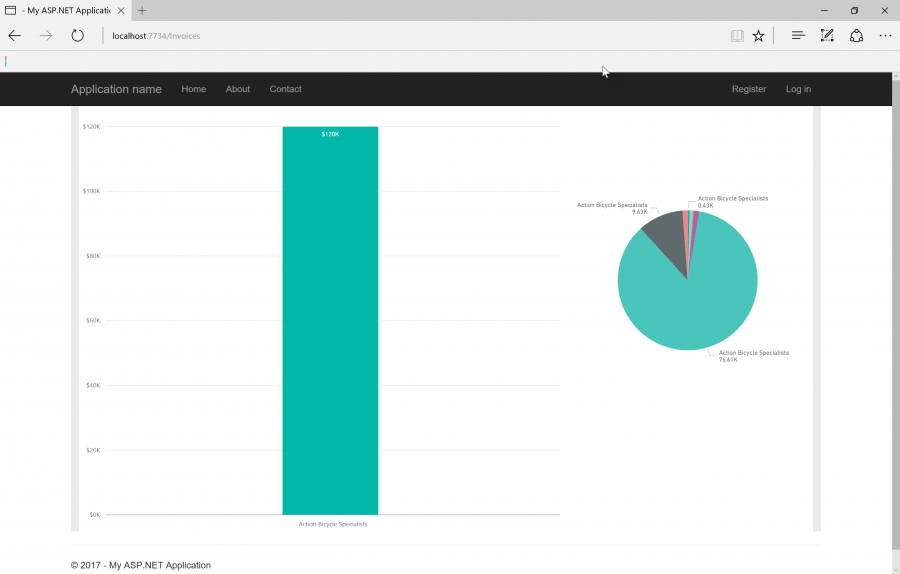
The report will contain two charts: the left one is a bar chart where you see the invoice history, and the right one is a pie chart that shows how products in the invoice(s) are distributed by category.
Note: in the sample database, all customers have only one invoice and they are all on the same date. 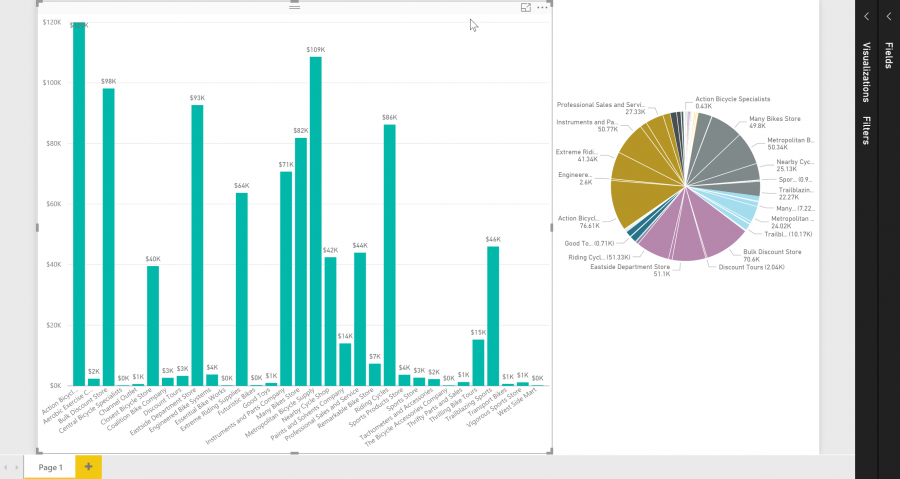
Now we need to create our dynamic Role. In the Modeling tab click on Manage Roles and create a CustomerRole mapping the CompanyName of the customer table to the variable USERNAME() 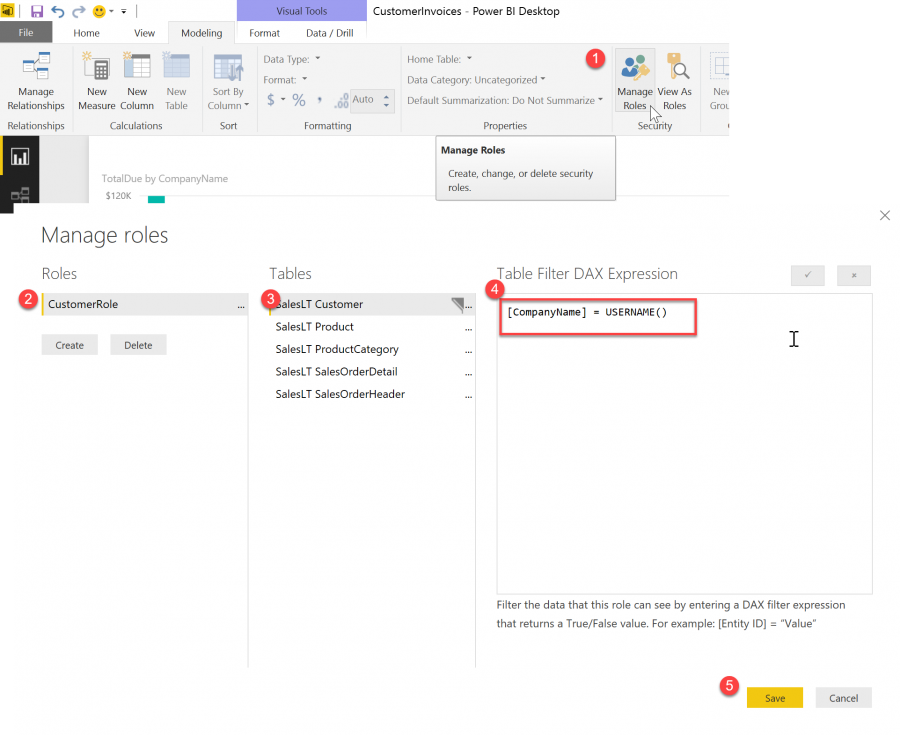
We need to test if our charts are really dynamic - so we can create other roles, and give them specific values ex: “Bike World” or “Action Bicycle Specialists." To visualize your report as those users, simply click on View as Roles in the Modeling tab, and select the role you want. 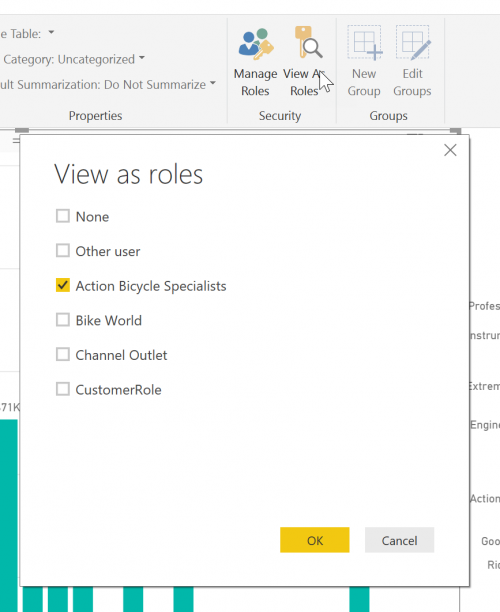
See how the charts look when seen from “Action Bicycle Specialists." 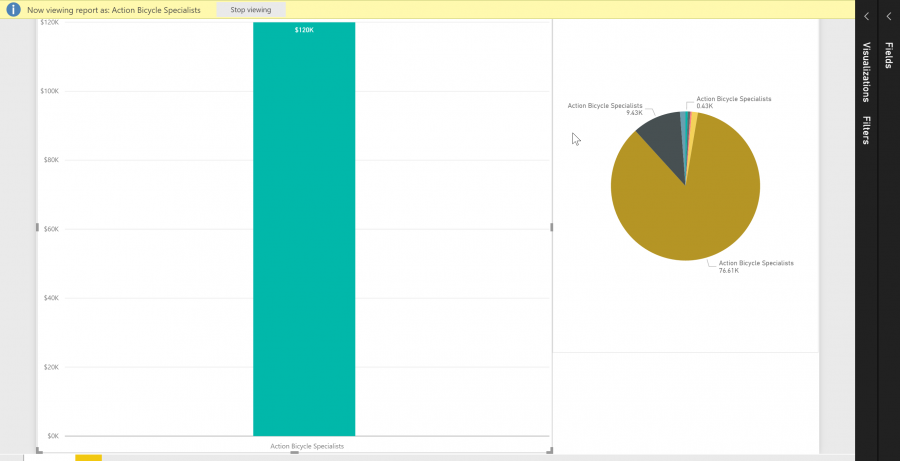
The report is now ready. Save it. We’ll need it soon.
Power BI-CLI
To upload our report in our Azure Workspace Collection, I like to use Power BI-CLI because it runs everywhere, thanks to Node.js.
Open a command prompt or Terminal and execute the following command to install Power BI-CLI:
npm install Powerbi-cli -g
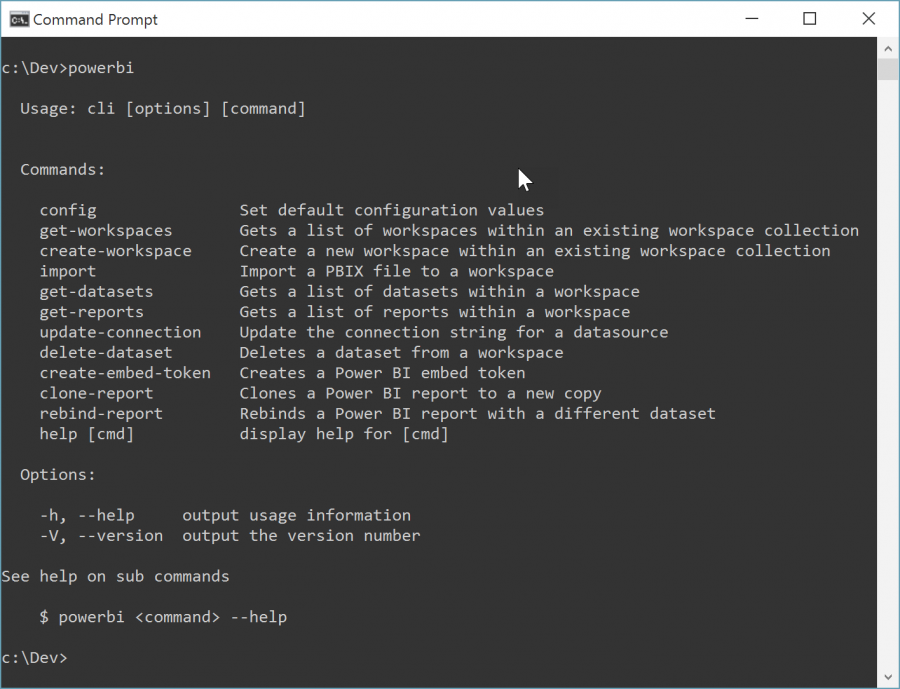
Now if you type ‘powerbi’ you should have the Power BI-cli help display.
It’s time to use the access key we got previously in this command, to create a workspace in our workspace collection.
 //== Create Workspace ===========
powerbi create-workspace -c FrankWrkSpcCollection -k
my_azure_workspace_collection_access_key
Now, let’s upload our Power BI report into Azure. Retrieve the workspace ID returned by the previous command and pass it as the parameter workspace.
 //== Import ===========
powerbi import -c FrankWrkSpcCollection -w workspaceId -k
my_azure_workspace_collection_access_key -f
"C:\PowerBIdemo\CustomerInvoices.pbix" -n CustomerInvoices -o
Now we will need to update the connection string of our dataset. Get his ID with the following command:
 //== Get-Datasets ===========
powerbi get-datasets -c FrankWrkSpcCollection -w workspaceId -k
my_azure_workspace_collection_access_key
Now update the connection string, passing the datasetId with the parametered.
 //== update-connection ===========
powerbi update-connection -c FrankWrkSpcCollection -w workspaceId -k
my_azure_workspace_collection_access_key -d 01fcabb6-1603-4653-a938-
c83b7c45a59c -u usename@servername -p password
In Visual Studio
The Power BI Embedded part is now completed. Let’s create the new Asp.Net MVC Web Application. A few Nuget packages are required, be sure to have those versions or the newest:
* Microsoft.PowerBI.AspNet.Mvc version=”1.1.7”
* Microsoft.PowerBI.Core version=”1.1.6”
* Microsoft.PowerBI.JavaScript version=”2.2.6”
* Newtonsoft.Json version=”9.0.1”
By default, Newtonsoft.Json is already there but needs an upgrade.
Update-Package Newtonsoft.Json
And for the Microsoft.PowerBI one, an install command should take care of all the other dependencies.
Install-Package Microsoft.PowerBI.AspNet.Mvc
We also need to add all the access information we previously used in our powerbi-cli into our application. Let’s add them in the web.config.
 ...
<appSettings>
    <add key="powerbi:AccessKey" value="my_azure_workspace_collection_access_key" />
    <add key="powerbi:ApiUrl" value="https://api.PowerBI.com" />
    <add key="powerbi:WorkspaceCollection" value="FrankWrkSpcCollection" />
    <add key="powerbi:WorkspaceId" value="01fcabb6-1603-4653-a938-c83b7c45a59c" />
</appSettings>
...
Here the code of the InvoicesController:
 using System;
using System.Configuration;
using System.Linq;
using System.Web.Mvc;
using demoPowerBIEmbedded.Models;
using Microsoft.PowerBI.Api.V1;
using Microsoft.PowerBI.Security;
using Microsoft.Rest;

namespace demoPowerBIEmbedded.Controllers
{
     public class InvoicesController : Controller
     {
         private readonly string workspaceCollection;
         private readonly string workspaceId;
         private readonly string accessKey;
         private readonly string apiUrl;

         public InvoicesController()

{

             this.workspaceCollection =
ConfigurationManager.AppSettings["powerbi:WorkspaceCollection"];
             this.workspaceId = ConfigurationManager.AppSettings["powerbi:WorkspaceId"];
             this.accessKey = ConfigurationManager.AppSettings["powerbi:AccessKey"];
             this.apiUrl = ConfigurationManager.AppSettings["powerbi:ApiUrl"];
         }

         private IPowerBIClient CreatePowerBIClient

         {
             get

             {

                 var credentials = new TokenCredentials(accessKey, "AppKey");
                 var client = new PowerBIClient(credentials)
                 {
                     BaseUri = new Uri(apiUrl)
                 };

                 return client;

              }

          }

          public ReportViewModel GetFilteredRepot(string clientName)
          {
              using (var client = this.CreatePowerBIClient)
              {
                  var reportsResponse =
client.Reports.GetReportsAsync(this.workspaceCollection, this.workspaceId);
               var report = reportsResponse.Result.Value.FirstOrDefault(r => r.Name ==
"CustomerInvoices");
                var embedToken =
PowerBIToken.CreateReportEmbedToken(this.workspaceCollection, this.workspaceId,
report.Id, clientName, new string[] { "CustomerRole" });

                var model = new ReportViewModel
                {
                  Report = report,
                  AccessToken = embedToken.Generate(this.accessKey)
                 };

                 return model;
            }

          }
          public ActionResult Index()
          {
              var report = GetFilteredRepot("Action Bicycle Specialists");
              return View(report);
          }
    }
}
The interesting part of this controller is the method GetFilteredReport. It gets all the reports from our workspaces. Then look for the one named CustomerInvoices. The next step is where the loop gets closed; it creates the token. Of course, we then pass the workspacecollection, workspace and report references. But passing only those references would result in reports where all customers were displayed. Obviously, that’s not what we want right now. The two last parameters are username and an Array of roles. When we created roles in Power BI Desktop, we created one call CustomerRole that was equal to the variable USERNAME(). So here we will pass the client name as username and specify that we want to use the role “CustomerRole."
Last piece to the puzzle is the View, so let’s add one.
 @model demoPowerBIEmbedded.Models.ReportViewModel

<style>iframe {border: 0;border-width: 0px;}</style>

<div id="test1" style="border-style: hidden;">
    @Html.PowerBIReportFor(m => m.Report,
               new { id = "pbi-report",
                      style = "height:85vh",
                      PowerBI_access_token = Model.AccessToken
       })
</div>

@section scripts
{
   <script src="~/Scripts/powerbi.js"></script>
   <script>
       $(function () {

           var reportConfig = {
             settings: {
                 filterPaneEnabled: false,
                 navContentPaneEnabled: false
                   }
              };
              var reportElement = document.getElementById('pbi-report');
              var report = powerbi.embed(reportElement, reportConfig);
        });
   </script>
}
One great advantage of using Asp.Net MVC is that we have an @Html.PowerBIReportFor at our disposal. Then we can instantiate the report with the call of ` PowerBI.embed(reportElement, reportConfig);`. I can pass some configuration to remove the navigation, and the filter panes, but that’s optional.
Now if we run our project, you should have a result looking like this:
Wrap it up
Viola! This of course was a demo and should be optimized. Please leave a comment if you have any questions, or don’t hesitate to contact me. It’s always great to chat with you.
References:

Frank Boucher is a trusted Microsoft Azure professional with over 15 years of experience in the IT industry. He’s leveraged his expertise in Microsoft Azure in a development role at Lixar IT, an Ottawa-based software company. At work, he leads a dedicated team of developers to advance technology in the mobile, air, and telecommunication industries. Outside of work, he is a sought-after speaker, author, and trusted collaborator on Microsoft Azure. Follow him on Twitter @fboucheros.