Primer on Power BI (Business Intelligence)
Editor’s note: The following post was written by SQL Server MVP Mark Tabladillo
Power BI is new and emerging self-service business intelligence and business analytics framework that brings together and enhances key Microsoft technologies:
- Office
- SQL Server
- Azure
- SharePoint
This document provides links and introductory information for Power BI. My analysis is more useful for the enterprise planner (CIO, CTO, Information Technology Architect), but also is useful for individual consumers. Power BI is a technology which extends from individual use on any device (laptop, tablet or smartphone) and all the way up to high-scale cloud or hybrid (cloud plus on premise) production architecture.
Books have already been written on aspects of the component Power BI technologies, and some will be recommended for further study. For this document, the purpose is to provide an overview of the key points in knowing what this technology is and how it might be useful in your organization. Along the way, I provide web links (URLs) to pages and videos that document and demonstrate key features of Power BI technology. In larger view, Power BI is at the heart of how Microsoft is now developing integrated aspects of the already-released technologies (Azure, SQL Server, Office, and SharePoint) and represents a direction for all these technologies for the foreseeable future.
The major sections of this report include:
- Definition – what is Power BI?
- Licensing Power BI – how can I or we get Power BI?
- Excel 2013 Features – what are the major features in on premise (legacy) Excel 2013?
- Power BI for Office 365 – what are the major features of the online Power BI for Office 365?
- Power BI with Excel 2010 – what can Excel 2010 users do with Power BI?
- Recommended Resources – where can I find free online resources and recommended paid books?
Definition
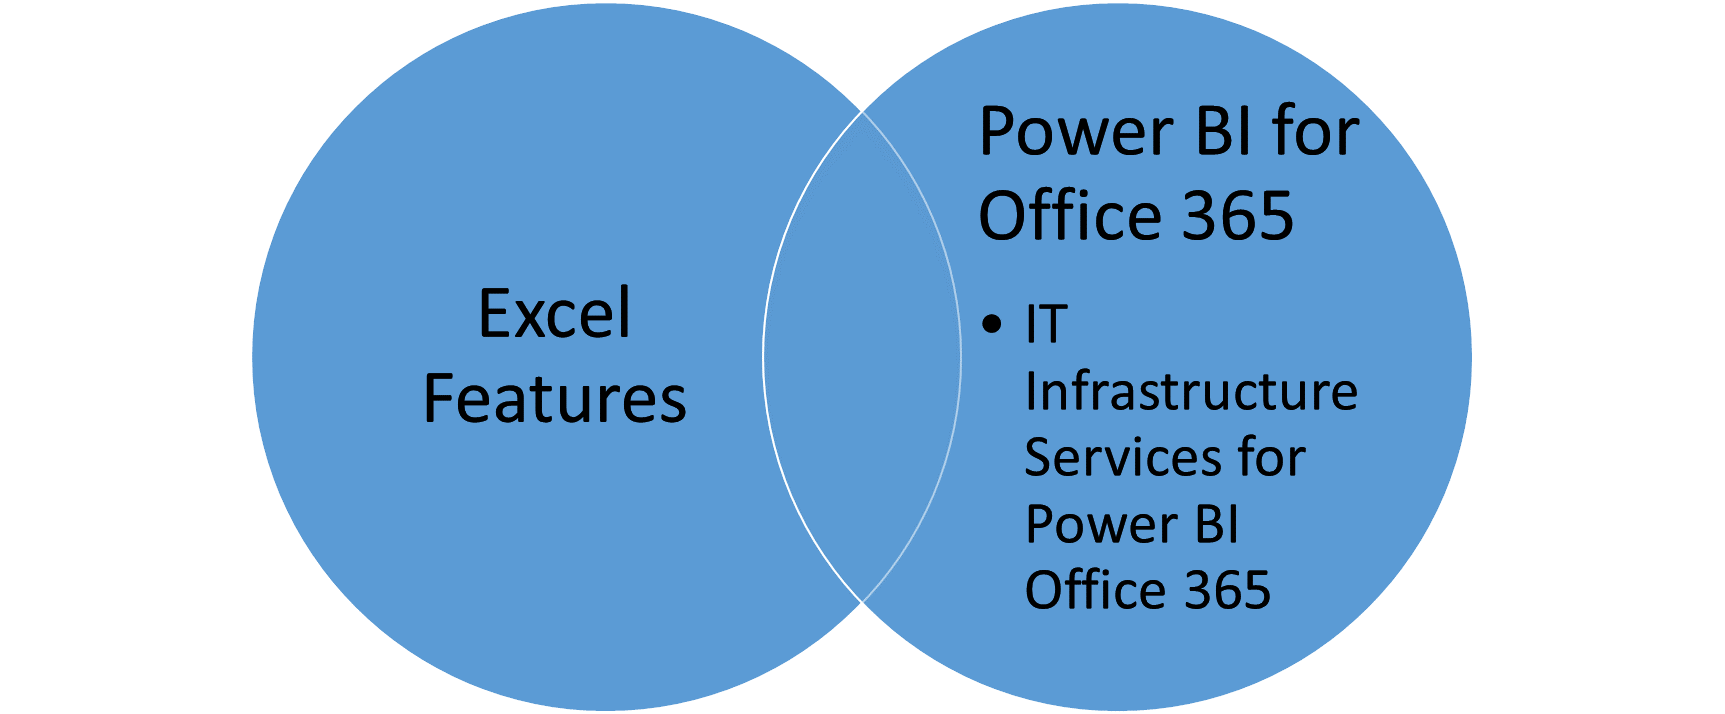
Formally, Microsoft claims that this technology is comprised of the following features and services:
Excel Features
Power BI for Office 365
IT (Information Technology) Infrastructure Services for Power BI Office 365
|
Many presentations I have seen on Power BI start with flashy demos and features. I have both seen and done such demos several times for user groups and a national conference called PASS Business Analytics Conference. I will recommend some video demos throughout this document, and provide some recommended links for further reading.
Though first, the licensing needs to be examined because Microsoft is offering more than just the legacy pricing options for Office. In this report, I will be discussing and emphasizing the Office 365 integration over the SharePoint integration. In my experience with consulting clients, a key question is how much the technology costs and how to obtain it.
Licensing Power BI
Licensing has been one of the most actively discussed aspects among current Power BI users. It is wise to spend some time on the topic up front. While some pieces of Power BI have been and are available for Office 2010, I support Microsoft in recommending that people obtain Office 2013 for a more stable technology and complete Power BI experience (especially if organizations are coming from Office 2007 or Office 2003 or earlier). The technology reason is that Excel 2013 Power Pivot is superior to Excel 2010 Power Pivot, and in enough ways to recommend the higher level.
While some pieces of Power BI have been and are available for Office 2010, I support Microsoft in recommending that people obtain Office 2013 for a more stable technology and complete Power BI experience (especially if organizations are coming from Office 2007 or Office 2003 or earlier). The technology reason is that Excel 2013 Power Pivot is superior to Excel 2010 Power Pivot, and in enough ways to recommend the higher level.
Power BI is not required for Office 2013. For people wanting Office as a one-time purchase, they can continue to obtain a single PC license in the United States:
- Office Home & Student 2013 – Word, Excel, PowerPoint, OneNote
- Office Home & Business 2013 – Word, Excel, PowerPoint, OneNote, Outlook
- Office Professional 2013 – Word, Excel, PowerPoint, OneNote, Outlook, Publisher, Access
Though, none of these three versions include Power BI Excel Features, which instead requires Excel 2013 or Office Professional Plus 2013 (available online here and also through volume licensing subscriptions, or through MSDN Premium or Ultimate subscriptions). I have a MSDN Ultimate subscription, and therefore I have the Power BI Excel Features.
If you only have Power BI Excel Features, you can start using many new self-service business intelligence features, and you can be happy having such abilities. However, these Excel Features are only part of the Power BI technology. In several online forums, many others who have the same MSDN Ultimate subscription level have been asking Microsoft to extend the benefits to include all of Power BI and not just the Excel Features.
For now, experiencing Power BI for Office 365 and the IT Infrastructure Services for Power BI currently requires a Power BI for Office 365 subscription. All Office 365 subscriptions require an annual commitment, and would have a penalty for early cancellation. In general, Office 365 subscriptions have been organized into several clusters, one for personal users, and the others toward different types of businesses. You could be a single person or private group and purchase a Business Use option. I listed these options in the following table, so that you can see it all in one place.
Personal Use (single account, priced per month, could be paid monthly)
Business Use (priced per user, per month) – details on the Microsoft Website
|
Recommendations
- If you are an individual, I first recommend the Office 365 Pro Plus subscription.
- If you are looking for a business, I would also add a Power BI for Office 365 subscription.
In a later section, I will describe what features of Power BI you could have using Office 2010 (and particularly Excel 2010). Even having Office 2010 should make someone happy with at least getting started. Again, I am recommending Office 2013 over Office 2010, though pragmatically many organizations (for example) already committed to Office 2010 before or as Power BI was being created.
Excel 2013 Features
The Excel Features work on-premises with either Excel 2010 or Excel 2013 (requiring an Office Professional Plus subscription, which comes with an MSDN Premium or Ultimate subscription). Again, Excel 2013 is my recommended platform for using this technology, and the focus of this section (a later section discusses the comparatively limited Excel 2010). The Excel Features are comprised of four elements, which I will summarize and provide key technical descriptions.
- Power Query– easily discover and connect to data from public and corporate data sources
- Power Pivot – create a sophisticated Data Model directly in Excel
- Power View– create reports and analytical views with interactive data visualizations
- Power Map– explore and navigate geospatial data on a 3D map experience in Excel
Some of the Power BI elements (like Power Pivot and Power View) are now native to Excel 2013. Other elements are add-ins, and sometimes may “disappear” from the ribbon: first try to enable them again from the COM add-in window, or secondly, uninstall and reinstall them. Naturally, the best situation is when these emerging features are native to the Office version. Not all these features directly impact SQL Server technology, though the one which most clearly extends SQL Server (Analysis Services) is Power Pivot.
Power Query
The development version of Power Query was termed “Data Explorer”. I first saw this technology under development and while interesting as a web application, it did not immediately excite me for its possibilities. Since then, the product is continuing to mature, and my interest has come to increase in what this technology can do. For power Excel users, I would hope that Power Query would become the default way to import data into Excel.
Power Query allows for some amount of data preprocessing during the import phase. Many of the steps which Excel users have come to do manually, such as splitting columns, removing columns or renaming columns, can be scripted within the Power Query interface. The software is wizard driven, and I did say scripting: underneath the technology is the Power Query Formula Language (informally known as “M”) allowing for future maturity into a reusable import technology. How that technology grows can depend on what Microsoft hears from the user community.
The next table summarizes many of the features. Having Power BI for Office 365 increases the features by allowing shared queries. This type of structure is to be expected: the standalone features would come with Excel, and having the Power BI for Office 365 cloud option opens up collaboration features.
Power Query Summary of Features
Standard Power Query features |
Value-added features with aPower BI for Office 365 subscription |
Easily discover, combine, and refine data for better analysis in Excel. |
In addition to the features in the standalone edition, securely share and manage your data queries within the enterprise in Excel. |

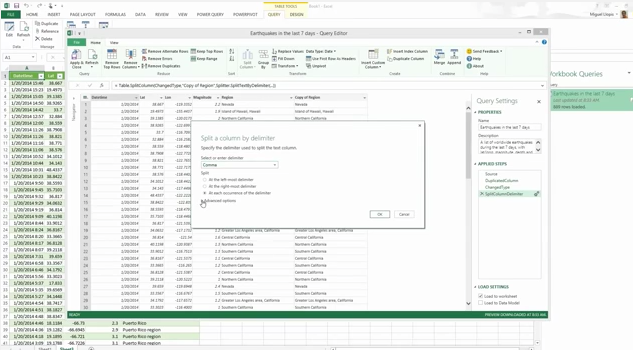
Inside Excel, here’s what the latest ribbon looks like in Excel 2013 x64:
The online search is considered a feature for searching your Power BI for Office 365 datasets. It becomes active once you sign in.
Beyond that first icon, the common “Get External Data” icons allow for reading any number of sources. The “From Web” link is often used in demonstrations, and permits searching website URLs or feeds. Other external data options include ODBC, SQL Server, Windows Azure, Microsoft Access, SharePoint Lists, OData, Windows Azure Marketplace, Hadoop File System, and even Facebook.
In process, the wizard will provide a preview of the data (once a connection, meaning authentication and authorization, are established). The preview window then allows for choosing the preprocessing steps for the data: though nothing happens until you submit the entire list. Along the way, the Power Query Formula Language builds the specific steps together into a query script. Once the preprocessing selections are done, you submit the list and the results come back to Excel. I recommend trying the technology yourself.
Limitations are important for power users, so I am including them in this report.
Power Query Specifications and Limits
Feature |
Limitation |
Query name length |
80 characters |
Invalid characters in a query name |
Double quotes (“), periods (.), leading or trailing whitespaces |
Number of cells in a Query Editor data preview |
3,000 cells |
Navigation pane items displayed per level: databases per server and tables per database. |
First 1,000 items in alphabetical order. You can manually add a non-visible item by modifying the formula for this step |
Size of data processed by the Engine |
Limited to available virtual memory (for 64-bit version) or about 1GB for 32-bit version, if data cannot be fully streamed, such as when sorting the data set locally before filling it |
Number of columns per table |
16,384 |
Maximum size of text in a preview cell |
1M characters |
Maximum size of text filled to Excel or data model |
Not limited by Power Query |
Maximum dataset size when evaluating a query |
256MB |
Maximum number of rows filled to worksheet |
1,048,576 |
Soft limit of persistent cache. A soft limit can be exceeded for periods of time. |
4GB |
Individual entries in the cache |
1GB |
Compressed query and dependencies as stored in the connection string. For more information about how to display connection information, see Display connection information. |
64K characters |
Action Steps:
- See the preview video for Power Query
- See Power Query key features
- Study Power Query key details
- Obtain the technology
Power Pivot
I will count Power Pivot as the first of the Excel features, at least the first one I saw. Of the four Excel features, this one has been where I have been spending most of the time with clients, and also my own presentations (I did some combining Power Pivot and data mining, which you can find on the web). This technology sits on top of what we now call xVelocity, a rapid summation and compression engine. The underlying technology now scales to production in what is called Tabular mode for Analysis Services.
Collectively, Power Pivot for Excel, Power Pivot for SharePoint and Tabular mode in Analysis services comprise key elements of what Microsoft has named the BI (Business Intelligence) Semantic Model:
BI Semantic Model

As with the rest of Power BI, this is an Excel feature which works well just on its own. However, there is also a technology path and way to share Power Pivot data models using either SharePoint or Tabular mode in Analysis Services. The interface is its own Excel window, but has a familiar spreadsheet-type interface which can declare data types and relationships among data models (tables).
Power Pivot Features

The DAX language permits programming custom measures. This language works with Power Pivot in Excel, but more generally also allows for querying Microsoft’s Multidimensional and Data Mining mode (OLAP cube) databases. Learning and using DAX is considered an intermediate to advanced Power Pivot skill.
Again, here are some summarized capacity specifications for Power Pivot. Please note that using a 32-bit system is an additional strain: only about 2.1 GB of memory is available for all Excel activity, including Power BI. I recommend that Power BI users upgrade from 32-bit (x86) to 64-bit (x64). Using x64, I have shown demos where Power Pivot can import over 2M records from a SQL Server data warehouse, and of course I was not even pushing the entire limit.
Some users report that because of their corporate environment, they were able to acquire a substitute: access to a virtual machine (perhaps shared) running x64 Office and accessed through Remote Desktop Connection Manager.
Data Model Specification and Limits
Product or Platform |
Maximum Limit |
Excel 2013 |
32-bit environment is subject to 2 gigabytes (GB) of virtual address space, shared by Excel, the workbook, and add-ins that run in the same process. A data model’s share of the address space might run up to 500 – 700 megabytes (MB), but could be less if other data models and add-ins are loaded. 64-bit environment imposes no hard limits on file size. Workbook size is limited only by available memory and system resources. |
SharePoint Server 2013 1 |
Maximum file size for uploading to a document library:
Maximum file size for rendering a workbook in Excel Services:
|
Excel Online in Office 365 3 |
250 megabytes (MB) total file size limit. Core worksheet contents (everything not in the Data Model) size limits according to file size limits for workbooks in SharePoint Online. |
Footnotes
1 On SharePoint Server, notice that the defaults that are much lower than the maximum allowed. Ask your SharePoint administrator about raising file size limits if your file is too big to upload or render. More information about Software boundaries and limits for SharePoint Server 2013.
2 Maximum Upload Size must be configured for each web application by a SharePoint administrator. Maximum Workbook Size must be configured in Excel Services by a service administrator. More information for administrators can be found in Configure Maximum File Upload Size on TechNet.
3 Limits in Office 365 are not configurable, but can change over time. Check the Office 365 for Enterprise Service Descriptions for the latest information. You can also see SharePoint Online: software boundaries and limits.
Power Pivot Capacity Specifications
Object |
Specification / Limit |
Object name length |
100 characters |
Invalid characters in a Name |
. , ; ' ` : / \ * | ? " & % $ ! + = () [] {} < > |
Number of tables per PowerPivot database |
(2^31) - 1 = 2,147,483,647 |
Number of columns and calculated columns per table |
(2^31) - 1 = 2,147,483,647 |
Number of calculated measures in a table |
(2^31) - 1 = 2,147,483,647 |
PowerPivot memory size for saving a workbook |
4GB = 4,294,967,296 bytes |
Concurrent requests per workbook |
6 |
Local cubes connections |
5 |
Number of distinct values in a column |
1,999,999,997 |
Number of rows in a table |
1,999,999,997 |
String length |
536,870,912 bytes (512 MB), equivalent to 268,435,456 Unicode characters (256 mega characters) |
Power Pivot is a feature of Excel 2013 (Office Professional Plus).
Action Steps:
- See the preview video for Power Pivot
- See Power Pivot key features
- Study Power Pivot for Excel 2013 key details
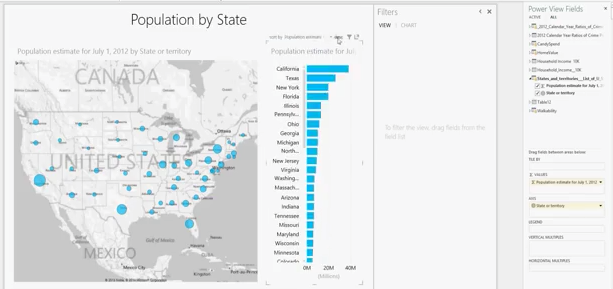
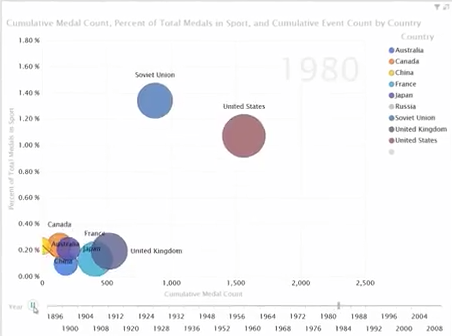
Power View
More than just a graphing interface, Power View surfaces an interactive work surface for exploring visual data. The technology targets both Excel and SharePoint. The technology for Excel is currently based on the Silverlight. Here are some screenshots of options:

Microsoft provides a few guidance documents for Power View specifications. Key to making Power View for Excel work includes making sure the prerequisite Silverlight is available. Viewing the results in browsers requires considering what specific browser version is used:
- System requirements for Power View
- Planning for Reporting Services and Power View Browser Support (SSRS 2014)
Power View is a feature of Excel 2013 (Office Professional Plus).
Action Steps:
Power Map
The fourth and final Excel feature for Power BI teams Bing Maps with Excel. The technology goes beyond just the standard 2D maps available with Excel or Power View, and extends mapping into three-dimensional views which can be turned into movies you can create.
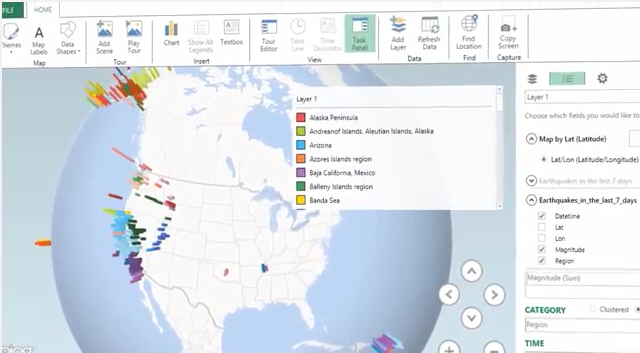


Within Excel, Power Map shares the same earlier-mentioned size limitations of Excel 32-bit (x86) or 64-bit (x64).
Action Steps:
- See the preview video for Power Map
- See the preview demo for Power Map
- See Power Map key features
- Getting started with Power Map
- Obtain the technology
Power BI for Office 365
As I mentioned earlier, Power BI for Office 365 extends what Power BI could achieve with Excel alone. The main two features of Power BI for Office 365 are collaboration (working with teams) and portability (working across locations and devices). The technology is viewed through web browsers, and therefore would allow teams to use whatever laptop, tablet, or smartphone device they have already invested in. It is true that collaboration can happen with SharePoint, and that software is separately licensed from the lengthy options already discussed.
The components of Power BI for Office 365 are:
- Power BI Sites – share, view, and interact with reports in these collaborative Power BI sites
- Power BI Q&A (Question and Answer) – use natural language queries to find, explore, and report over your data
- Query and Data Management – share and manage queries and data sources, and view query usage analytics
- Power BI Windows Store App– view reports on the go, with the Power BI app
The first action step is to view the two minute preview video on Power BI for Office 365.
Power BI Sites
This technology is comprised of websites you make with your Power BI content. Organizing your information on the web allows collaboration (teams) and portability (location and devices). Click this link to see the preview video.
Power BI Sites
This technology is comprised of websites you make with your Power BI content. Organizing your information on the web allows collaboration (teams) and portability (location and devices). This feature is considered an aspect of SharePoint online. Click this link to see the preview video.

Power BI Q&A (Question and Answer)
This technology opens up a way to query inside data stored on Power BI sites. Based on Bing search technology, the interface interprets natural language entries and provides data results. Click this link to see the preview video.

Query and Data Management
These features are an inherent part of the Power BI sites. Collaboration requires knowing what happens with that information.

Click this link to study the Data Management Experience in Power BI Office 365.
Power BI Windows Store App
Power BI for Office 365 already allows for HTML5 rendering for mobile devices (including laptops, tablets and smartphones). Though, the native Power BI Windows Store App extends that functionality for Windows devices. The consumption experience matches Power BI sites. Click here for the preview video.
Managing Power BI for Office 365
As mentioned in the introduction, there are other features which involve managing Power BI for Office 365. We can expect these features to grow and improve, as Microsoft often asks the community for input on what features people would find useful.
IT (Information Technology) Infrastructure Services for Power BI Office 365
- Provision Power BI for Office 365 – create a tenant, and get Power BI for your organization
- Power BI Admin Center – manage your organization’s Power BI infrastructure from a site
- Data Management Gateway – connect on-premises data to the cloud, seamlessly and securely
Power BI with Excel 2010
The following chart summarizes the key elements of Power BI, and what would be available for users of Excel 2010.
Software |
Solution |
Power Pivot |
A version one of Power Pivot is available for Excel 2010. Microsoft’s website provides video, demos, and hands-on labs to try out the software.
Opening up an Excel 2010 Power Pivot workbook in Excel 2013 requires an irreversible upgrade (meaning that collaboration between Excel 2010 and Excel 2013 users is not possible – pick one version or the other). There are some technical details involved in upgrading, which you can study by clicking this link.
|
Power Map |
Power Map is not available for Excel 2010.
Versions of Excel previous to 2002 had a native map feature. Though, advanced Excel users will know about Microsoft MapPoint, which has gone through nineteen versions since its debut. Sadly, MapPoint is being discontinued as of December 31, 2014. You might be able to obtain a copy now, or through some MSDN subscriptions.
|
Power Query |
Power Query is available for Microsoft Office 2010 Professional Plus with Software Assurance. There are two versions, one for 32-bit (x86) and one for 64-bit (x64).
|
Power View |
Power View is not available for Excel 2010.
|
Recommended Resources
First, the free Microsoft digital books – these books include some Power BI topics like DAX, but generally all types of Microsoft topics:
Next, I generally recommend reading Microsoft’s website and documentation https://msdn.microsoft.com. Often, the documentation integrates video and demos: Microsoft has become better in doing that. A general site for Power BI video is Channel 9, which has many videos from Microsoft technical conferences.
Finally, there are books you buy. Many of my MVP friends and other equally-skilled professionals have authored books on Power BI topics. More continue to be published, some of them came out this month (July 2014), and most of them are generally available in both hardcopy and digital formats. All these listed books are on some aspect of Power BI.
Collie, R. (2012). DAX Formulas for PowerPivot: A Simple Guide to the Excel Revolution: Holy Macro! Books.
de Jonge, K. (2014). Dashboarding and Reporting with Power Pivot and Excel: How to Design and Create a Financial Dashboard with PowerPivot – End to End: Holy Macro! Books.
Ferrari, A., & Russo, M. (2013). Microsoft Excel 2013 Building Data Models with PowerPivot: Microsoft Press.
Jelen, B., & Collie, R. (2014). PowerPivot Alchemy: Patterns and Techniques for Excel: Holy Macro! Books.
Larson, B., Davis, M., English, D., & Purington, P. (2012). Visualizing Data with Microsoft Power View: McGraw-Hill/Osborne Media.
Webb, C. (2014). Power Query for Power BI and Excel: Apress.
Summary
Hopefully, this report provides good background information on Power BI. Feel free to contact me with feedback, either through my website https://marktab.net or on Twitter @marktabnet.
About the author

Mark provides enterprise data science analytics advice and solutions. He uses Microsoft Azure Machine Learning, Microsoft SQL Server Data Mining, SAS, SPSS, R, and Hadoop (among other tools). He works with Microsoft BI (SSAS, SSIS, SSRS, SharePoint).
Mark has a been a public voice for analytics since 1998: Microsoft TechEd, PASS Business Analytics Conference, Predictive Analytics World, SAS Global Forum, PASS Summit. He is a SQL Server MVP, a trainer and consultant with SolidQ, and teaches part-time at the University of Phoenix. His blog is at https://marktab.net
About MVP Mondays
The MVP Monday Series is created by Melissa Travers. In this series we work to provide readers with a guest post from an MVP every Monday. Melissa is a Community Program Manager, formerly known as MVP Lead, for Messaging and Collaboration (Exchange, Lync, Office 365 and SharePoint) and Microsoft Dynamics in the US. She began her career at Microsoft as an Exchange Support Engineer and has been working with the technical community in some capacity for almost a decade. In her spare time she enjoys going to the gym, shopping for handbags, watching period and fantasy dramas, and spending time with her children and miniature Dachshund. Melissa lives in North Carolina and works out of the Microsoft Charlotte office.