Visio 2013 & Visio Services – A Quick Guide
Editor’s note: The following post was written by SharePoint MVP Alan Richards
Microsoft Visio has been around for a number of years and as a product it has grown as new versions have been released. However it has always had problems when sharing diagrams produced with Visio, well with the 2013 versions of Visio, SharePoint and Office 365 all that has changed, now sharing is as easy as uploading the diagram to a document library and telling the users where it is.
Unfortunately we haven’t got the blog space to go through the process step by step so the screenshots below and explanation show you what can be done with Visio Services, all the examples are using a simple list in Office 365 (Figure 1)
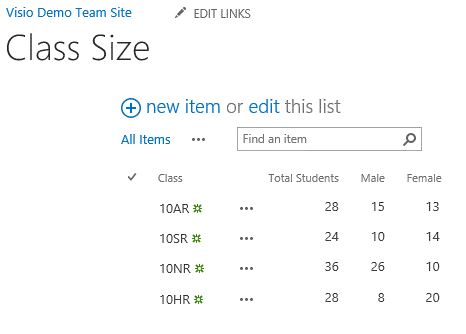
Figure 1 - Showing SharePoint list
Connecting Data
The first step in the process is to create a Visio drawing with the data connected to it, Figure 2 is the first screen in a process that is fairly straightforward when connecting data and is launched using the Data | Link Data To Shapes option on the ribbon, as you can see from Figure 2 Visio can connect to quite a few sources of data
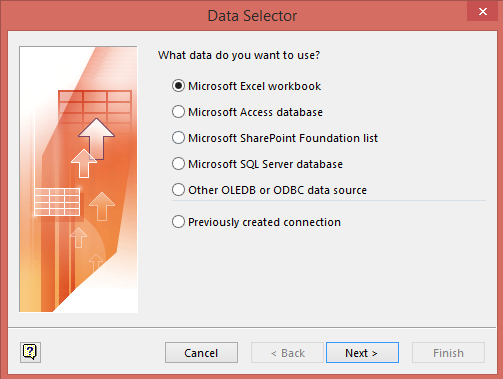
Figure 2 - Showing first screen in data linking wizard
Once the data is connected it will appear in the bottom of the Visio screen as shown in Figure 3
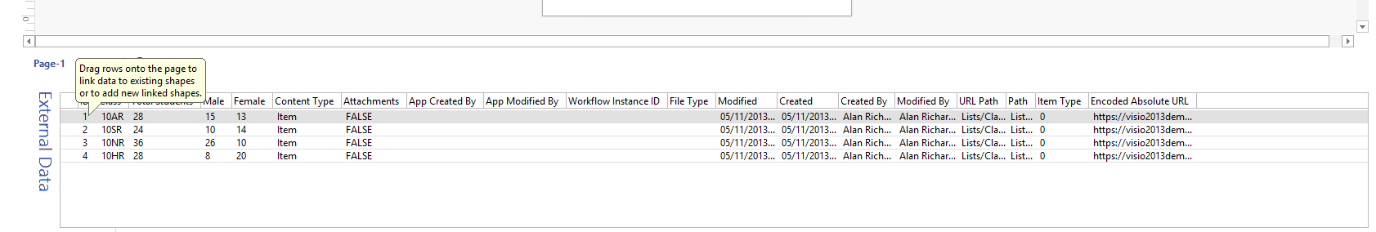
Figure 3- Showing data in Visio client
Data Graphics
Visio uses shapes and data graphics added to the page to visualise the data, Figure 4 shows some of the data graphics that can be used in Visio, these include text callouts, data bars & colour by value to name a few
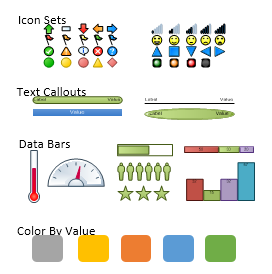
Figure 4 - Showing some of the data graphics available
To add a data graphic to the page simply drag a row of data onto the Visio page and you should see the standard text callout appear as shown in Figure 5

Figure 5 - Showing standard text callout data graphic
I could just front all the data on the same page, which for this small amount of data wouldn’t be an issue. Figure 6 is an example of a simple data dashboard using all the data visualised at once

Figure 6 - Showing simple data dashboard
Bit boring though and also of no use if you have lots of data to present so let’s change it so that only the class is shown on the page and we can then create new pages with more data on them and use hyperlinks to jump between pages
To edit the data graphics right click and select Data | Edit Data Graphic Figure 7 shows you the relevant screen now with only the class field present
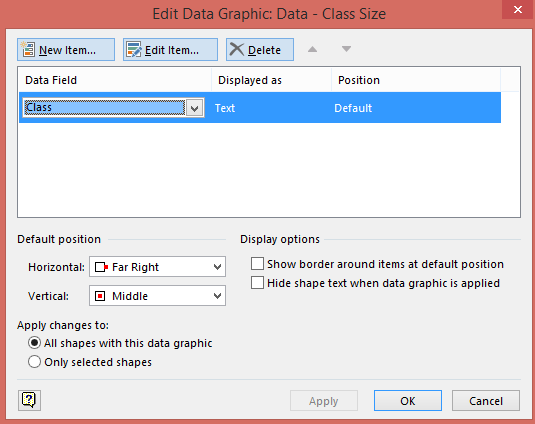
Figure 7 - Showing edit data graphic dialogue box
Using Hyperlinks
One of the great features of Visio is hyperlinks, these can be used to jump between pages, making it appear to the user that they are simply drilling down into the data
Firstly create a new page and add the data you require to the page by dragging the row onto the page, then right click on the data graphic and remove the data graphic. The reason for this is that if you edit it then you will also change the graphic on your original page.
Once you have removed the data graphic, right click on the data box and select Data | Edit Data Graphic and add the required data, Figure 8 shows the data selected from the list for this page
Figure 8 - Showing data graphic properties
We now need to flip back to Page 1 and create the hyperlink, to do this right click on the data graphic and select Hyperlink
Figure 9 shows the dialogue box then you then use to create the hyperlink, in this case to Page-2. It could of course be an internet link or to any other page you created in what could be a very large multi-page Visio drawing
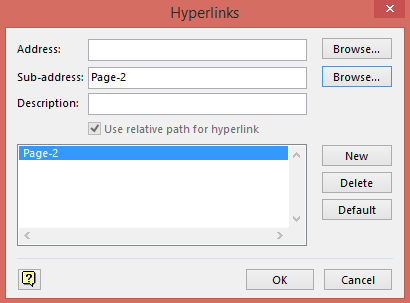
Figure 9 - Showing hyperlink settings
Using Visio Services
All of that was great but up until now we have only been using Visio 2013, Visio Services comes into play when we upload the Visio drawing to SharePoint, in this case Office 365. Figure 10 shows the file saved to a document library in Office 365
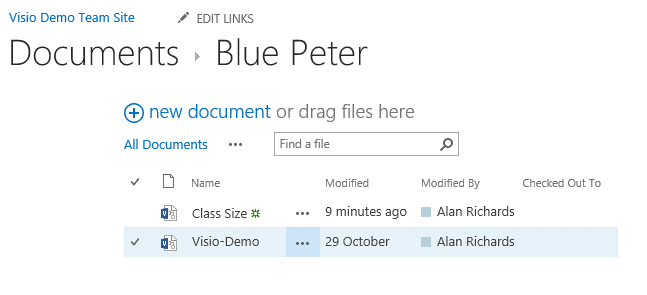
Figure 10 - Showing uploaded Visio drawing
Clicking on the Class Size drawing will open it up within Office 365 and allow you to zoom in and out and scroll around the drawing; and the best thing the user wouldn’t need the Visio client to interact with the drawing. Figure 11 shows the drawing opened in Office 365
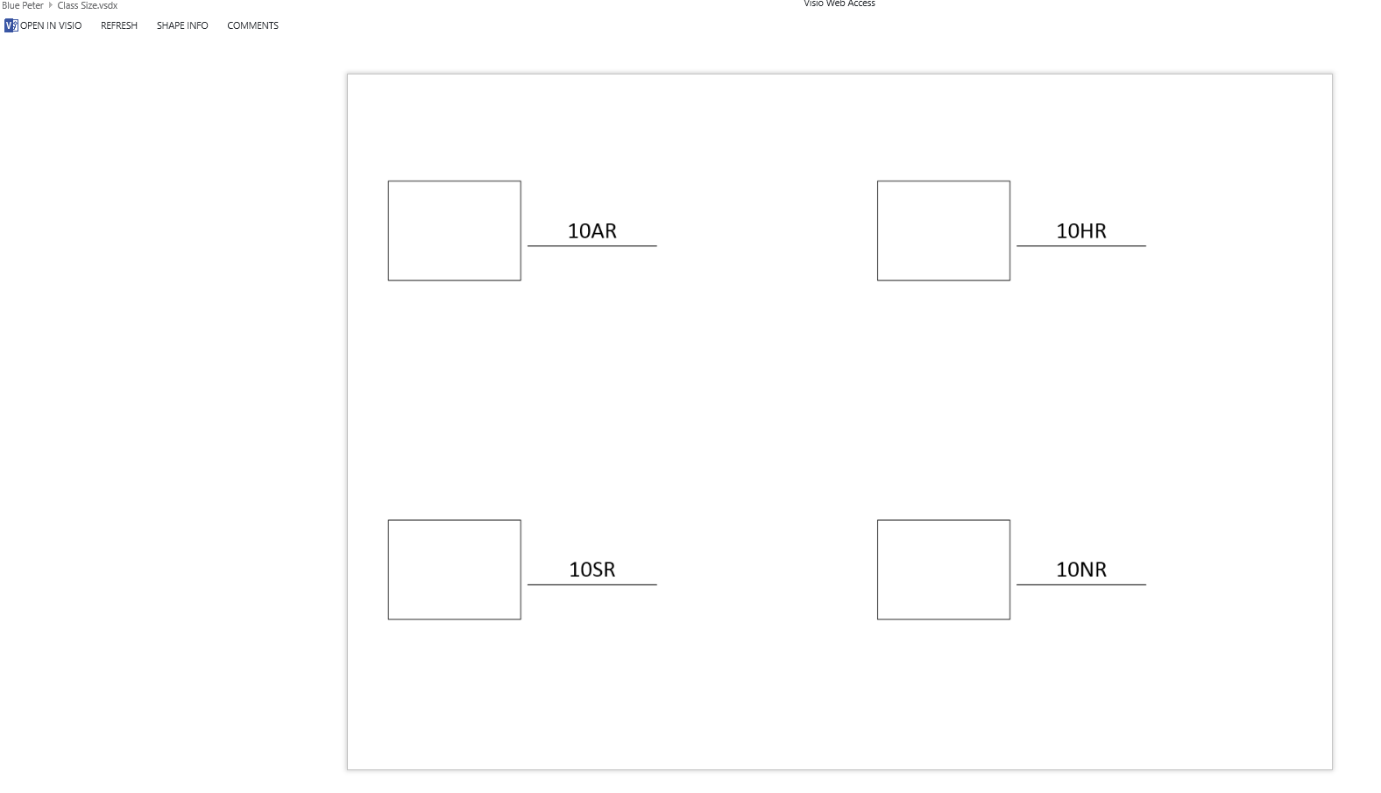
Figure 11 - Showing Visio drawing open in Office 365
So what about the hyperlink I hear you ask; well the hyperlink works as any hyperlink would work in a browser, clicking on the graphic for 10AR will take you to the page shown in Figure 12
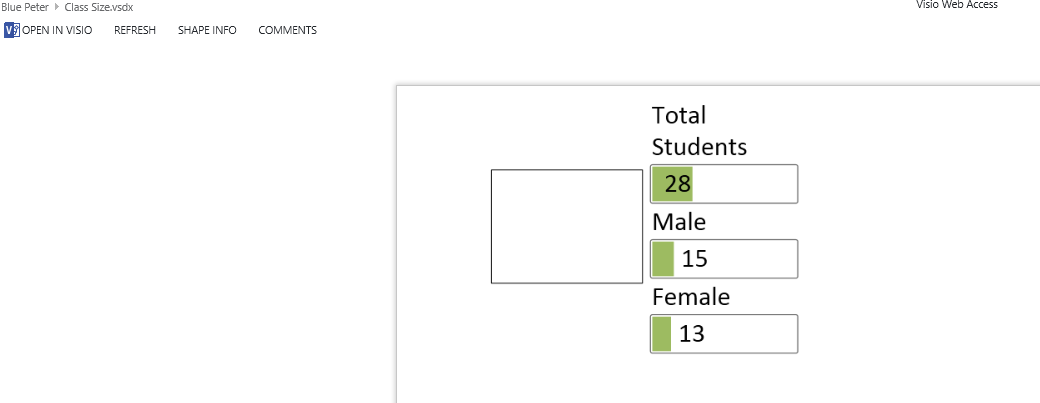
Figure 12 - Showing additional data page
Comments
As you can see from Figure 12 there is a Comments tab, click this will allow the user to add comments to the page and as more users add comments so the drawing becomes more of a collaboration
Users obviously can’t change the data in the drawing but if they have access to the data source, they can change the data there and that will immediately be reflected in the Visio drawing.
In Conclusion
So what I have shown you today is a very simple Visio drawing with a simple hyperlink to give the impression of the user drilling down into the data
This of course is only the tip of the iceberg when you start to use the Visio client and Visio Services. The data graphics shown are just simple boxes, as well as being able to use the shapes that we are all familiar with when it comes to Visio you can also, with a little more work, use images taken from the Internet or your own images. Another great feature is the ShapeSheet, using this you can change the shape, colour or size of shapes using the source data, the ShapeSheet is just like an Excel spreadsheet; it just controls the features of a Visio shape
Images are only just a small element, there is also the interactive nature of the product now that users can add comments to drawings it becomes more collaborative than was ever possible with older versions of Visio and the best thing about all this, it can all be shared with users without them ever needed access to the Visio client
Unfortunately there just isn’t enough blog space to detail all of the great new features of Visio client and Visio services but I am sure more blog posts will appear on both my blog and also in the wider community
About the author

Alan Richards has been working in the IT industry for over 17 years and during that time has been at the forefront of using IT. He has led teams that have been among the first to roll out Windows, Exchange and SharePoint, many of these successes have been showcased in Microsoft case studies. Recently Alan's work has concentrated on SharePoint & Office 365 and the implementation of these technologies in organisations to enhance business processes and efficiency. Alan is currently working as Senior Consultant at Foundation SP, a SharePoint & Office 365 strategy and delivery company who were recently awarded Microsoft Partner of the year for portals & collaboration. Alan is also a regular speaker & blogger and has been a SharePoint MVP since July 2011. Follow him on Twitter.
About MVP Monday
The MVP Monday Series is created by Melissa Travers. In this series we work to provide readers with a guest post from an MVP every Monday. Melissa is a Community Program Manager, formerly known as MVP Lead, for Messaging and Collaboration (Exchange, Lync, Office 365 and SharePoint) and Microsoft Dynamics in the US. She began her career at Microsoft as an Exchange Support Engineer and has been working with the technical community in some capacity for almost a decade. In her spare time she enjoys going to the gym, shopping for handbags, watching period and fantasy dramas, and spending time with her children and miniature Dachshund. Melissa lives in North Carolina and works out of the Microsoft Charlotte office.