Time Intelligence in PerformancePoint Services
Editor's Note: The following MVP Monday post is by SQL Server MVP Rod Colledge
Time Intelligence in PerformancePoint Services
Introduction to Time Intelligence
PerformancePoint Services, part of SharePoint Enterprise 2010, can be used to create sophisticated Business Intelligence (BI) dashboards. A common inclusion in BI Dashboard designs are time filters, allowing users to control the date range of the dashboard. For example, filter the product sales graph for the last 3 months.
PerformancePoint Services includes a feature known as Time Intelligence. Put simply Time Intelligence is the ability to use expressions such as Last Year, Last 6 Months, Yesterday, This Financial Year etc … The Intelligence lies in the ability of the system to recognize the expression, and apply it to the current date in order to derive the correct date context for reports, significantly improving the usability of the system from an end-user’s perspective.
When building Business Intelligence systems with PerformancePoint Services, Time Intelligence functionality can be created in at least two places; in the Analysis Services cube(s) used by the dashboard, and/or Dashboard Designer, covered below, which is the tool used to create BI dashboards for PerformancePoint Services.
Time Intelligence Logic; Cube or PerformancePoint?
In most Microsoft based Business Intelligence installations, there is usually at least two or three different front-end visualization tools used, such as Reporting Services, Excel, PerformancePoint and possibly some 3rd party tools.
Assuming that all of these tools use an Analysis Services cube as the primary data source, it makes sense to implement the time intelligence logic there, which means that other applications can reuse this logic in a consistent manner. Having said that, there is significant Time Intelligence functionality that can be created with the Dashboard Designer tool, and covering that functionality will be the focus of this article.
Introduction to Dashboard Designer
Dashboard Designer is the tool used to create and deploy Business Intelligence components to be rendered through PerformancePoint Services 2010 in a SharePoint 2010 site. Dashboard Designer includes several different components, including;
· Data Sources, such as Analysis Services databases
· Reports, of which there are many types such as Analytical Charts and Grids
· Filters, used to present users with options for controlling the display of reports
· Scorecards, and their associated objects such as KPIs and Indicators
· Dashboards, which frame the components together for deployment to a SharePoint site
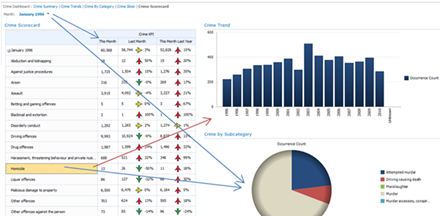
Shown below is an example dashboard page showing the components working together. Each dashboard can have multiple pages, and each page can contain multiple graphs and scorecards, with each controlled by one or more filters.
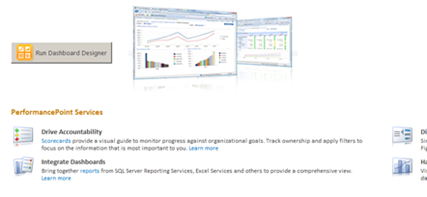
After creating a Business Intelligence Centre in SharePoint 2010, the dashboard designer tool can be launched by clicking the Run Dashboard Designer button, as shown below.
Setting up Time Intelligence
The starting point for configuring PerformancePoint Time Intelligence is to create a data source and configure the Time properties, accessed by clicking on the Time tab for the data source.
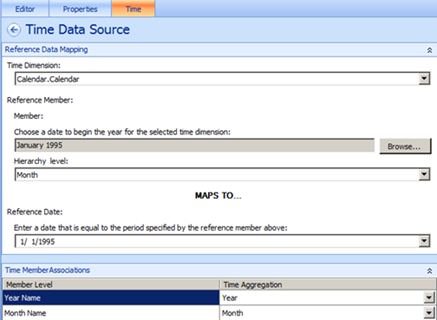
As shown below, a reference data source and mapping is used to tell PerformancePoint how the time dimension in the cube is used, and what time attributes exist. In this case, we’ve selected the Calendar dimension, chosen January 1995 as the reference member, selected Month as the date level, and then selected a date (1/1/1995) as the date which maps to the chosen reference member. We finish by creating time member associations by linking our Calendar attributes to the common time elements such as Year and Month.
The end result of those steps is enough for PerformancePoint to understand the mapping between our cube’s time dimension, and what it uses internally for time controls.
Creating Time Filters
Once the data source is setup, we can then create a filter with the required time intelligence formulas such as Last Year. When creating a new filter, we choose the Time Intelligence template, as shown below.
After selecting the Time Intelligence template, we specify the data source to use, selecting one that has been setup for time intelligence as covered in Setting Up Time Intelligence, and then create the Time Intelligence formulas that will manifest as filter selections. Examples of Time Intelligence formulas include;
Formula |
Description |
|
|
Year:Year-2 |
Last 3 years e.g.; 2012, 2011, 2010 |
Quarter-1 |
Last Quarter |
Day+1 |
Tomorrow |
Month:Month-5 |
Last 6 Months |
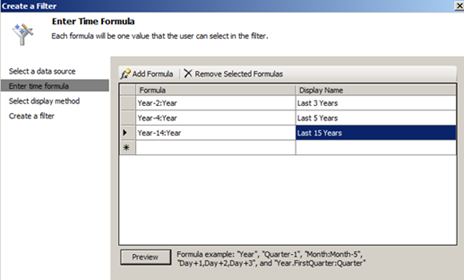
We can add Time Intelligence Formulas to the filter by simply clicking Add Formula, and then specifying both the formula and the display name, as shown below. The Preview button will display the MDX for the selected formula, useful for validating the formula against the cube.
Using Time Filters
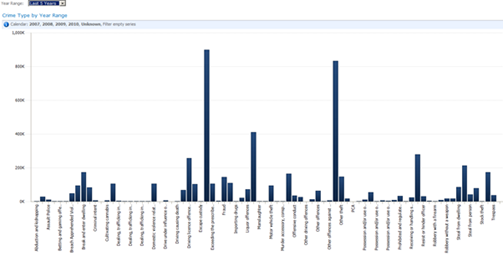
With the above in place, we can now use our time filters like any other filter by connecting them to our dashboard graphs as required. Shown below is an example Time Intelligence filter where the user has selected “Last 5 Years” to filter the graph below.
Time intelligence filters are a good example of how we can improve the overall user experience for our PerformancePoint BI Dashboards. Don’t hesitate to contact me for any further details on any aspect of this blog post. Thanks for reading!
About the author
Rod Colledge is a director and principal consultant with StrataDB, a specialist SQL Server Business Intelligence firm based in Brisbane, Australia, and has been working with SQL Server since 1996. Rod specializes in the development of Business Intelligence solutions for his clients using the Microsoft SQL Server and SharePoint platforms. He's a regular presenter at SQL Server events both locally and around the world, presenting at PASS 2009 and 2011 in Seattle and TechEd Australia 2010. In September 2007, Rod founded sqlCrunch.com, a website specializing in summarizing and categorizing links to SQL Server white papers and best practices. He blogs at rodcolledge.com, recently authored the Manning published book "SQL Server 2008 Administration in Action", assisted with the technical editing of the first edition of the "SQL Server MVP Deep Dives" book, and contributed a chapter to the second edition.
About MVP Mondays
The MVP Monday Series is created by Melissa Travers. In this series we work to provide readers with a guest post from an MVP every Monday. Melissa is a Community Program Manager for Dynamics, Excel, Office 365, Platforms and SharePoint in the United States. She has been working with MVPs since her early days as Microsoft Exchange Support Engineer when MVPs would answer all the questions in the old newsgroups before she could get to them.
