10 Days for Office 2010: Be More Productive with Office and Project 2010
Editor's Note: The following is a guest post by Microsoft Project MVP Bill Raymond as part of the MVP Award Program Blog's series "10 Days for Office 2010".
The No-confusion Timeline Report
As a Project Manager, it has always been a struggle to communicate a clear timeline to my key sponsors, stakeholders and even to the project team.
Even as a Project Manager it can be difficult to read a Gantt chart once it goes beyond 50 lines or so. Granted, you get comfortable with the plan after a while and no how to traverse a detailed project plan but even the people on your project team may not fully understand all the intricacies.
In previous versions of Microsoft Project, I would spend a lot of time plotting out massive prints of the project plan, creating a breakdown structure and then spend hours every week or two copying data to Excel or Visio to format the output for mass consumption.
Earlier versions of Microsoft Project had some nice features to copy certain levels of a schedule to PowerPoint and provide some visual reports for Excel but clearly communicating the timeline was still problematic.
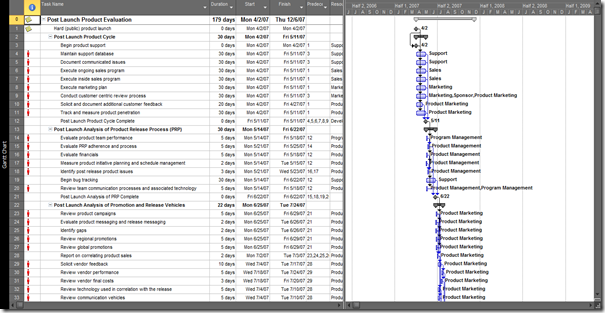
The challenge Microsoft faced was a way to change a graphic that looks like this:
Into something more appealing that highlights the key activities and milestones we are working towards. With the new Timeline View in Microsoft Project 2010 Professional, life just became much easier. Now, you can easily add any tasks to a visually appealing report that is easily output to e-mail, PowerPoint or for large-scale color printing.
The Timeline View graphic shown above is an output of a project with more than 80 tasks. It visually represents key dates and milestones that the entire project team and all stakeholders agreed to track. The color coding and placement of the text are easily formatted and can even be manipulated further from within other Office products.
Cross Posted at The Office Blog

