Welcome Azure Usage and Billing Portal
Today, we are very excited to announce the availability of Azure Usage and Billing Portal (AUBP) as an open-source project under GitHub Microsoft organization. Having wide range of Microsoft Azure Cloud services available, we know that users or organizations want to get detailed insights about the consumed services. Some of the AUBP usage scenarios including but not limited to are: A company with a single azure subscription is tagging the created services by department name so each department’s usage details can be reported according to tags. A school tracks each student’s Azure usage details (i.e. how many hours of Unix VM is used by student X, how much data downloaded by student Y or who uses 512 GB RAM VMs etc.) with a single report. Or a developer can set alerts to be notified in case there is an anomaly in his/her startup’s web app activity etc. Once the subscription owner gives a consent (which may be revoked at any time by him/her) to the AUBP system, portal administrator can get up to date visual or csv report about the current and historic cost/usage details about all registered subscriptions in the system. This features in mind, as a reference application, AUBP project is developed and open-sourced for your collaboration. In this blog post I will try to answer and give a bit more technical details about the project.
AUBP portal has two web based user interface; one is accessible by anyone to let them register/unregister any number of their Azure Subscription to the system, other is an authenticated access portal where up-to-date usage and billing details of the registered subscriptions can be monitored. You can get more general overview about the AUBP system at Microsoft Azure Blog site.
If you want to customize or deep dive into AUBP project, Azure Resource Usage and RateCard APIs is the starting point. You can also explore open source Code Samples that uses these APIs. These samples show you how to access raw usage/cost details through console or web applications.
Main idea behind the AUBP project is to create an Azure Active Directory (AD) Application (something like a user account) in the AUBP platform and get a consent for this AD app from any subscription owner so thisr AD app can access that subscription with restricted functionality. For more technical details on this process you may refer to “Developer’s guide to auth with Azure Resource Manager API”
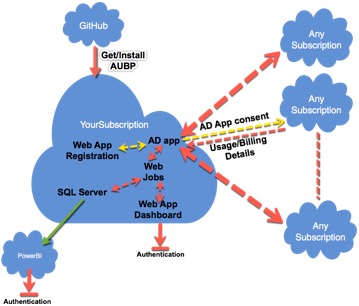
Architecture overview of the AUBP
Any user can access to “Registration Web App” that is hosted on your subscription and enter their own credentials to let your AD app to be able to access their billing details. Here AUBP is not accessing or storing etc. your credentials, everything is done transparently on the cloud as you may see through the source code. Giving consent to the AD app (registering the AD app into your AD in your subscription) doesn’t mean that the app can do anything on your subscription. Access details are explained in the authentication stage, and just limited to get usage/billing details, nothing else.
With default configuration, web job runs once per day and collect previous day’s usage/billing details of a subscription. Frequency of this process can be adjusted through WebJob’s configuration file. Data collected through Billing API by the WebJob is stored in an SQL server. By this way, it is possible to create custom PowerBI (one sample already provided in the GitHub Repo) report based on this data.
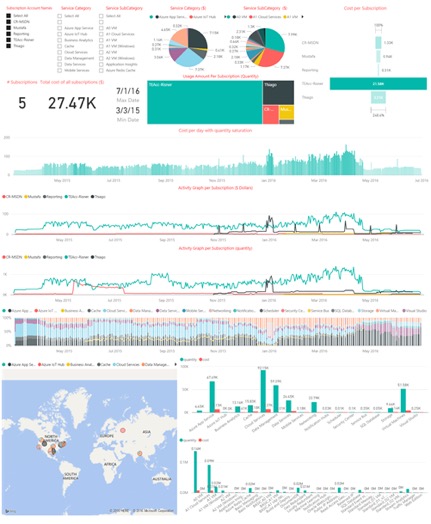
Default report generated by AUBP
As in the above default report, you can filter out all or few registered subscriptions to be monitored with several criteria. You can see the result of real-time interaction immediately on the report. Because PowerBI reports are interactive, if you click/select any graph, shape etc. on the report, only the selected feature will be highlighted with respect to the others etc. In addition, the intensity of the bars in bar charts matters. i.e. First bar chart from top, “Cost per day with quantity measures”, shows the cost of all services under all or selected subscriptions per day in a date range (if you haven’t applied other filters) magnitude of the bar shows the amount but intensity shows the quantity of the service used. i.e.
If you are monitoring many subscriptions with a wide range of date interval, which means millions of records on the SQL DB, be sure that you are using right tier of services (i.e. higher tier SQL server for many I/O operations possible by PowerBI etc.) Or if it took so much time to collect per subscription daily usage data, then scale up concurrent WebJob count in the config file or on the portal.
We highly recommend to have general knowledge on Azure Resource Usage and RateCard APIs and Developer’s guide to auth with Azure Resource Manager API to develop similar projects or customize this one.