How to find assemblies loaded in an AppDomain
Our developer specialist from Malaysia, Jonathan Yong, is explaining how to list the assemblies loaded by a particular Web Application in IIS in this detailed blog post. Read on!
When helping customer to migrate ASP.NET application, we need to identify the assemblies loaded by the application. For typical process, you can just use listdlls.exe from SysInternals tools to list all the DLL loaded into a process. However, if you have multiple web applications loaded into the same w3wp, each application is isolated into different AppDomains. In such case, we need to list the assemblies loaded into the AppDomain of the target application only.
In this blog, I will show, step by step, how you can do this. The same technique can be used if you are troubleshooting issue related to assemblies loading such as application loaded the wrong assembly version or the application has dependency on an assembly which you don’t know where it is loaded from.
The tools I used are:
- SysInternals procdump
- Windbg
- Notepad++
The general steps are:
- Capture a dump
- Opening the dump file
- Set Symbol Path
- Load SOS debugger extension
- Dump AppDomain
- Analyze Assemblies
Capture a dump
To create a memory dump of the w3wp process, we use SysInternals’s Procdump tool. Open a command prompt (If you are using Vista/Windows Server 2008 or above, you need to elevate as administrator).
Run the following command : Procdump –ma <pid> <dumpfile.dmp>
PID is the process ID which you can find out from the task manager. The dump file can be of any name and if you don’t provide one, its name will have the following format w3wp_<date>_<time>.dmp.
The dump file may take a while to complete and during this time, the process will freeze. If you are running on Windows 7 and later, you could add the -r parameter to tell procdump to minimize this freeze time.
Opening the dump file
Open the Windows Debugger (windbg) from the Debugging Tools for Windows. You need to use the Windbg with the processor architecture (x86 or x64) which match the target process dump you want to analyze, not the current Windows bitness. For example, use Windbg x86 for a 32 bit application dump on a 64 bit Windows.
To open a dump file, go to File -> Open Crash Dump, or simply drag the dump file from Windows Explorer into Windbg.
Set Symbol Path
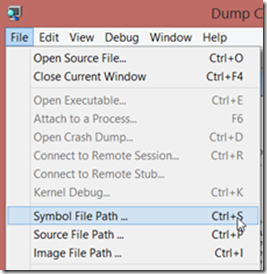
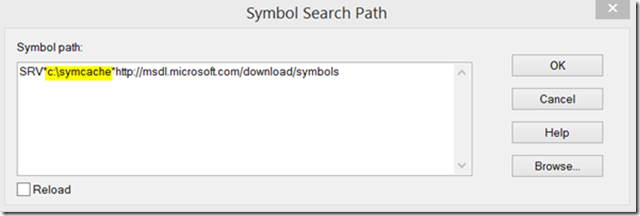
We need to set the symbol path so that the debugger know where to download symbols required for the analysis. Go to File -> Symbol File Path, set the symbol path to SRV*c:\symcache*https://msdl.microsoft.com/download/symbols. The local folder c:\symcache is where the downloaded symbol files will be cached. The folder can be of any name. Check the Reload checkbox and click OK to close the dialog.
Load SOS Debugger Extension
The Windows debugger knows nothing about .NET code. In order to analyze managed dump, we need to load the managed extension into Windbg. The way to get the extension is different depends on whether you are debugging .NET 2.0-3.5 app or .NET 4.x app.
To load the managed extension for .NET 2.0 to 3.5, run this command in Windbg : .loadby sos mscorwks and press <Enter>.
To load the managed extension for .NET 4.x, run this command in Windbg : .loadby sos clr and press <Enter>.
Each version of the .NET framework is installed with sos.dll and the .loadby command ask the debugger to load the sos.dll extension from this same folder. The trick is to provide the CLR dll which is either mscorwks.dll in .NET 2.0-3.5 and clr.dll in .NET 4.0.
Dump AppDomain
To list all AppDomains in the managed process and the assemblies loaded in each AppDomain, run this command in Windbg : !dumpdomain and press <Enter>.
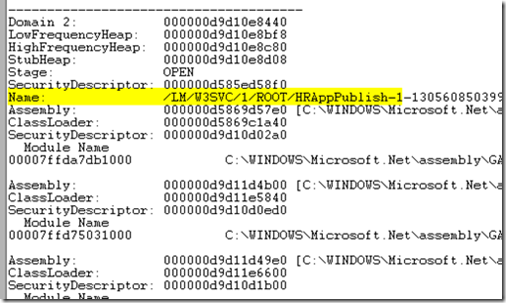
In the output, each AppDomain is separate by a line of hypen (-). Each web application run in its own AppDomain.
You can now look for the AppDomain for your application identified by the Name. Then scroll through the list to find the assembly you are looking for.
Analyze Assemblies
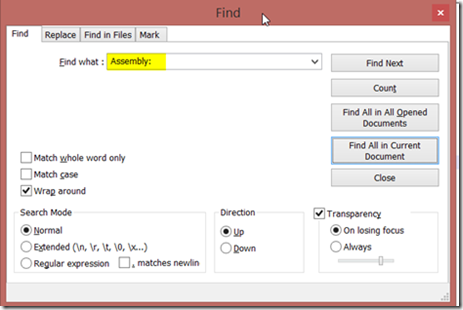
However, this list is long and provides other information that adds a lot of noise. To make the task easier, you can copy the section of the AppDomain for your application (separate by line of hypen) to Notepad++. Use the Find function to search for Assembly: , then click Find All in Current Document.
This will show all matching lines which has the search term in a separate window at the bottom of the editor.
It is much easier to scan through the list now. The path of the assembly tell you where the assembly is loaded from. Eadch assembly in the bin folder of the application will be copied in to ASP.NET temp folder and loaded from there. To find the origin path of the assembly, go to the folder pointed to by the AppDomain dump. Inside the folder, there will be a __AssemblyInfo__.ini file.
Open the ini file and you will be able to locate the origin path of the assembly.


