The case of the broken AppFabric
This article has been contributed by Vasco Preto, a Premier Field Engineer with Microsoft Portugal. Vasco is no stranger to MSPFE, having previously contributed a very interesting case study on our TechNet blog. This time he shares a captivating walkthrough on how to troubleshoot AppFabric caching services.
I’ve been recently involved in troubleshooting a production problem reported by a customer which revolved around a generic error that was preventing client applications from successfully establishing a connection to the AppFabric – Caching Services layer. Here’s a quick recap of what the exact symptoms were and the analysis and diagnostic that resulted from the troubleshooting effort.
Problem description
The client presented a specific case where a set of recently deployed client applications were unable to connect to the AppFabric – Caching Services layer. This specific error was generating the following message (extracted from the event logging system).
{Microsoft.ApplicationServer.Caching.DataCacheException: ErrorCode<ERRCA0017>:SubStatus<ES0006>:There is a temporary failure. Please retry later. (One or more specified Cache servers are unavailable, which could be caused by busy network or servers. Ensure that security permission has been granted for this client account on the cluster and that the AppFabric Caching Service is allowed through the firewall on all cache hosts. Retry later.)
Furthermore, the client stated that this error was only affecting a subset of client applications and these specific client applications had functioned correctly in the past and, supposedly, they had not been subjected to any change recently.
Analysis
Step 1: Check for known issues
Considering the starting point, which was little more than a fairly generic message, I did a quick search through existing KB articles in an attempt to clarify which conditions could actually lead to this type of error. Unfortunately, this quick research did not produce a more defined and limited scope to investigate, as there are many different conditions that can lead to problems which are reported through error code ERRCA0017 and sub-status code ES0006.
Step 2: Check if the AppFabric cluster is running
Considering that the client was describing the problem as a connection error between client applications and AppFabric server, I started off my direct troubleshooting effort by verifying that the AppFabric cluster was in fact up and running. Using some administrative PowerShell commands I concluded that the AppFabric server was in fact working properly (commands used include Get-CacheClusterHealth, Get-Cache and Get-CacheStatistics).
Afterwards, I verified if I could in fact establish a TCP connection between client and server machines through the AppFabric port, which is port 22233. By using a simple telnet client utility I did in fact verify that the client application was able to connect to the server through port 22233. However, when that connection was established through AppFabric’s client libraries the previously showed error would appear.
Step 3: Gathering network traces
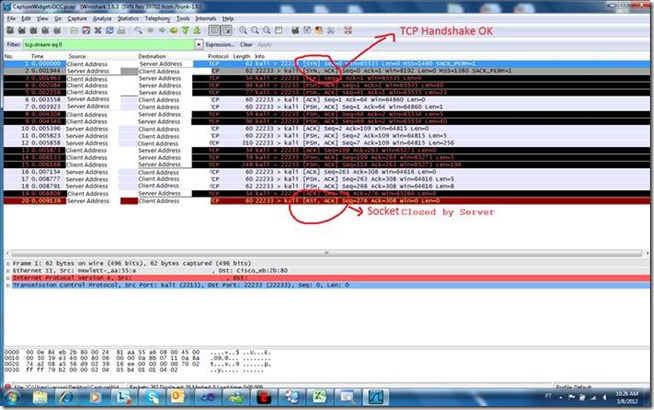
At this point, I was able to get a few network traces supplied by the customer’s operations team. As shown in the following image, which depicts the filtered frames that pertain to the action of establishing the AppFabric connection (filtered by client and server IP addresses), we can clearly see two things:
- The initial TCP/IP handshake between client and server was correctly established.
- A few frames after the handshake, the server reset the connection.
Step 4: Drilling down into the network trace
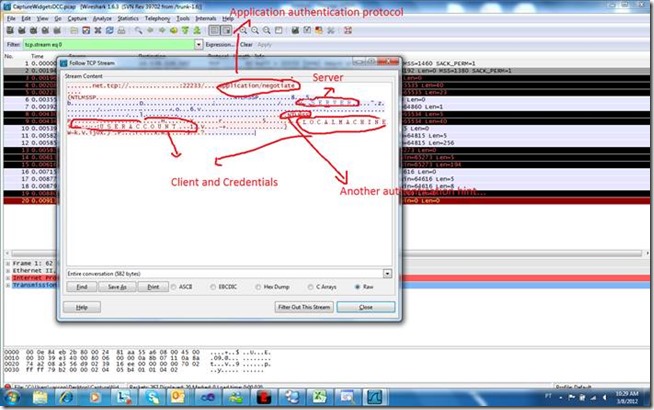
Continuing within the network trace, and following the TCP stream regarding these frames, I could drill down on a bit more information. As seen in the next image, the information contained within the network trace showed a few more interesting pieces of information:
- Information regarding the client and its credentials.
- Identification of the server to which the communication was being established.
- References to authentication protocols.
Step 5: Checking which accounts have access to AppFabric
At this point, I discussed the situation with the customer and we both agreed that the problem seemed to be related with client credentials and inherent authentication process. Going back to the PowerShell administration console, we analyzed which accounts had been granted access to AppFabric. As shown in the next output, the existing configuration was apparently allowing a wide open access to all client credentials.
PS C:\Windows\system32> Get-CacheAllowedClientAccounts
EVERYONE
ANONYMOUS LOGON
Despite this configuration, I queried the customer about the exact credentials that the client was sending (which were also identifiable in the previously shown TCP stream – please note reference to local machine) and we concluded that the client application was using a local account. As such, the customer agreed to change the client credentials and the client application was reconfigured to use a domain account.
Step 6: AppFabric logging and ETW
Unfortunately this change did not fix the problem so we analyzed other available troubleshooting options and decided that we needed to get more logging data from AppFabric. By the way, this avenue has impact as it requires restarting the cache service, which implies temporarily restarting one of the cache cluster nodes, and hence temporarily affecting performance (other cache nodes are not directly affected, but regions within this node will ultimately need to be re-populated from ground up afterwards). After some debate, the client accepted this route and we performed two actions.
Firstly, we changed the logging level of the caching service by adding the following configuration elements to its configuration file (file DistributedCacheService.exe.config).
<system.diagnostics>
<sources>
<source name="System.ServiceModel"
switchValue="Information, ActivityTracing"
propagateActivity="true">
<listeners>
<add name="traceListener"
type="System.Diagnostics.XmlWriterTraceListener"
initializeData= "c:\Temp\DistributedCacheService.svclog" />
</listeners>
</source>
</sources>
<trace autoflush="true" />
</system.diagnostics>
Secondly, we activated ETW for AppFabric through the following command line:
tracelog.exe -start debugtrace -f "c:\Temp\cachedebugtrace.etl" -guid "c:\Windows\System32\AppFabric\Manifests\ProviderGUID.txt" -level 5 -cir 512
Step 7: Analyzing ETW
After acquiring the ETW log we transformed it into a CSV file through the command:
tracerpt "c:\Temp\cachedebugtrace.etl" -o "c:\Temp\cachedebugtrace.csv" -of CSV
And by analyzing its contents we were able to find some interesting information such as:
"Recoverable exception raised - ChannelID = 29180324 System.ServiceModel.ProtocolException: Stream Security is required at https://www.w3.org/2005/08/addressing/anonymous, but no security context was negotiated. This is likely caused by the remote endpoint missing a StreamSecurityBindingElement from its binding. at System.ServiceModel.Channels.ServerSessionPreambleConnectionReader.ServerFramingDuplexSessionChannel.SetupSecurityIfNecessary() at System.ServiceModel.Channels.ServerSessionPreambleConnectionReader.ServerFramingDuplexSessionChannel.OnOpen(TimeSpan timeout) at System.ServiceModel.Channels.CommunicationObject.Open(TimeSpan timeout) at Microsoft.ApplicationServer.Caching.WcfServerChannel.Listen(IAsyncResult result)"
Interestingly, this message hints that there is something definitely wrong with the security context, but not necessarily implying problems with credentials. It also suggests that there are some issues with the underlying WCF transport that is used between client application and AppFabric server whenever the AppFabric API is used.
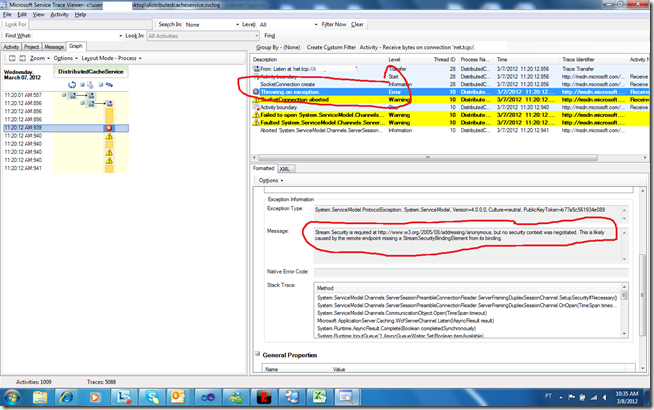
The error message is almost clear to the point that it identifies the lack of a required security context, which results in a binding error to an existing WCF endpoint. To confirm this we opened the log file (the svclog file generated by the changes introduced in the distributed cache service configuration file) which confirmed what had been established so far (as shown in the following picture).
In possession of all this information we went back to the configuration files of both client application and AppFabric server and concluded that there was indeed a mismatch, as the client configuration (contrary to what was defined in the server side configuration) was using None as the configuration value for both securityMode and protectionLevel (more information on these options can be found here.
Finally, the solution!
So, finally, to fix the problem we changed the securityMode to Transport and the protectionLevel to EncryptAndSign and, having matched client and server configuration attributes, the solution was finally up and running.
To wrap up, it is almost inevitable to report that, as it turns out, someone had, inadvertently, copied a configuration file from development environment to production, thinking that they were an exact match, without verifying that the security configuration elements were in fact distinct.
I guess this is another example that supports the prohibition of direct copying from development and quality environments into production environments, although a more clear error message from AppFabric would also be much appreciated ![]() .
.
Written by Vasco Preto; posted by MSPFE Editor Arvind Shyamsundar


