Traffic Analysis with Microsoft Data Explorer
For the past couple months, I’ve been running a simple app on my desktop which records the estimated length of my commute using Bing Maps Traffic. The output is stored in a CSV file. The CSV file looks like this:
12/1/2011,5:07 PM,HomeToWork,22:26
12/1/2011,5:07 PM,WorkToHome,33:44
12/1/2011,5:12 PM,HomeToWork,22:47
12/1/2011,5:12 PM,WorkToHome,35:20
12/1/2011,5:17 PM,HomeToWork,22:09
12/1/2011,5:17 PM,WorkToHome,35:33
12/1/2011,5:22 PM,HomeToWork,22:04
12/1/2011,5:22 PM,WorkToHome,34:49
12/1/2011,5:27 PM,HomeToWork,21:42
I created a Data Explorer document that reads in the CSV file and calculates the average commute time at five minute intervals. Rather than walking you through this step by step in the UI, I’ll just share the source of the document with you:
section Section1;
HomeToWork = let
Log = Embedded.Content("log.csv"),
ImportedCsv = Csv.Document(Log),
FilteredRows = Table.SelectRows(ImportedCsv, each [Column3] = "HomeToWork"),
SplitColumnDelimiter = Table.SplitColumnByDelimiter(FilteredRows,"Column4",":",{"Column4.1", "Column4.2"},Occurrence.All),
ChangedFormat = Table.TransformColumns(SplitColumnDelimiter,{{"Column4.1", Number.FromText}, {"Column4.2", Number.FromText}, {"Column1", DateTime.FromText}, {"Column2", DateTime.FromText}}),
InsertedCustom = Table.AddColumn(ChangedFormat, "Duration", each [Column4.1]*60+[Column4.2]),
InsertedCustom1 = Table.AddColumn(InsertedCustom, "MinutesFromMidnight", each DateTime.Hour([Column2])*60+DateTime.Minute([Column2])),
HiddenColumns = Table.RemoveColumns(InsertedCustom1,{"Column3", "Column4.1", "Column4.2"}),
RenamedColumns = Table.RenameColumns(HiddenColumns,{{"Column1", "Date"}, {"Column2", "Time"}, {"Duration", "TripDuration"}}),
FilteredRows1 = Table.SelectRows(RenamedColumns, each DateTime.Hour([Time]) < 12)
in
FilteredRows1;WorkToHome= let
Log = Embedded.Content("log.csv"),
ImportedCsv = Csv.Document(Log),
FilteredRows = Table.SelectRows(ImportedCsv, each [Column3] = "WorkToHome"),
SplitColumnDelimiter = Table.SplitColumnByDelimiter(FilteredRows,"Column4",":",{"Column4.1", "Column4.2"},Occurrence.All),
ChangedFormat = Table.TransformColumns(SplitColumnDelimiter,{{"Column4.1", Number.FromText}, {"Column4.2", Number.FromText}, {"Column1", DateTime.FromText}, {"Column2", DateTime.FromText}}),
InsertedCustom = Table.AddColumn(ChangedFormat, "Duration", each [Column4.1]*60+[Column4.2]),
InsertedCustom1 = Table.AddColumn(InsertedCustom, "MinutesFromMidnight", each DateTime.Hour([Column2])*60+DateTime.Minute([Column2])),
HiddenColumns = Table.RemoveColumns(InsertedCustom1,{"Column3", "Column4.1", "Column4.2"}),
RenamedColumns = Table.RenameColumns(HiddenColumns,{{"Column1", "Date"}, {"Column2", "Time"}, {"Duration", "TripDuration"}}),
FilteredRows1 = Table.SelectRows(RenamedColumns, each DateTime.Hour([Time]) > 12)
in
FilteredRows1;CalculateAverages = (FilteredRows) => let InsertedCustom2 = Table.AddColumn(FilteredRows, "Bucket", each Number.RoundDown(([MinutesFromMidnight])/5)),
Summarized = Table.Group(InsertedCustom2, {"Bucket"}, {{"AverageTripTime", each List.Average([TripDuration])}}),
InsertedCustom3 = Table.AddColumn(Summarized, "Time", each (#time(0,0,0)+#duration(0,0,[Bucket]*5,0))),
HiddenColumns1 = Table.RemoveColumns(InsertedCustom3,{"Bucket"}),
ReorderedColumns = Table.ReorderColumns(HiddenColumns1,{"Time", "AverageTripTime"}),
SortedRows = Table.Sort(ReorderedColumns,{{"Time", Order.Ascending}})
in
SortedRows;shared HomeToWorkAverages = CalculateAverages(HomeToWork);
shared WorkToHomeAverages = CalculateAverages(WorkToHome);
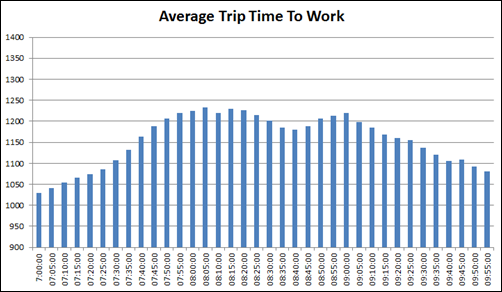
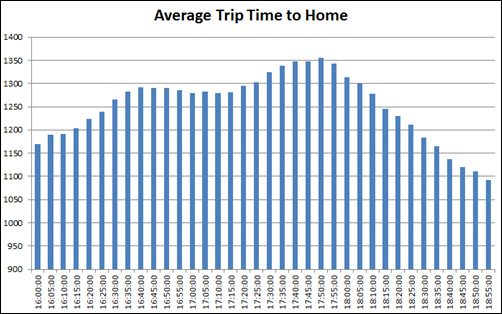
The steps are pretty similar for the HomeToWork resource and the WorkToHome resource so I could probably have pulled more out into functions, but this works and it got me the answer. Once I had finished, I published the result and opened it in Excel. From there I was able to create these charts:
This isn’t a terrific example of the product because this same thing could probably have been accomplished right in Excel, but I’m a tester so I’m always looking for new little test ideas like this.

