The ultimate showdown of NoSQL destiny!
Sharks and bees and... fast Italians?!
If you've been following this blog recently, you'd have noticed that I'm having a blast trying different data products on Azure and playing with them. I recently managed to get Spark / Spark SQL (Shark's replacement) running on Azure in the same way, but rather than dedicate a post to them, I thought it'd be more fun to pit them all against each other, throwing Hive on HDInsight into the mix, in a friendly competition to analyze some data on my Azure blob storage. So without further ado, I present the ultimate showdown!
The scenario
When I thought this up, I didn't want to design or even steal a precise scientific benchmark to execute (like TPC-DS for example), since I wasn't interested in precise performance benchmarking and I wouldn't be able to tune each one sufficiently anyway. (If you want a more scientific benchmark that compares some of the products here, I found this awesome effort to be pretty informative.) Instead I wanted a simple scenario the likes of which I see a lot, but artificial enough that I'd be able to play with it/release the code for it so anyone can replicate it. So I came up with the following: we'll have a simulated Cloud application in which each VM logs operation messages to blob store in a simple comma-separated format. For this toy example, each log is either a) a start of an operation, b) a success or c) a failure. The business questions we want each of our contestants to answer are:
- How many failures/successes did each VM get?
- How long did the average successful operation take on each VM?
I came up with these two questions as a good starting set for this experiment because the first one can be answered with a single scan through the data, while the other would require a self-join to correlate the start and finish messages for each operation. Which gives me a good feel for how the different contestants at least handle this first level of complexity.
The data
Now that I had a scenario in mind, time to cook up some data! I created a simple Azure Compute service where each instance just churns out as fast as it can log messages to its own CSV log file on my Azure blob container. Each line in that file is of the format "{date},{instance name},{operation id},{message}", where date is in a Hive-friendly format, operation ID is a GUID and message is a free-form string so I can throw in a little string manipulation later.
I also cooked up the data so that every tenth role instance (0, 10, 20) would have a higher random operation failure rate, and every seventh instance (0, 7, 14, 21, 28) would have a higher operation duration. This way I can double-check myself and the contestants later to see if we can catch these anomalies.
With that in hand, I deployed it to Azure with 30 (small) instances. They were churning out data pretty fast so I shut it down after about 10 minutes when I had 35.1 GB of data to chew on: this seemed like enough data to make a decent first cut, but not so much that I'd have to worry about sharding across storage accounts to start with.
(Note: all the code used for this experiment is in the public github repo here.)
Enter our first contestant: Hive/HDInsight
So let's start the showdown with Hive/HDInsight: our supported and longest standing NoSQL product in this arena. I spun up an 8-node HDInsight cluster backed by a SQL Azure Hive metastore (so I can use it later with the other contestants), created an external Hive table pointing to my logs, and started issuing the queries using the awesome relatively new Hive portal on the HDInsight cluster.
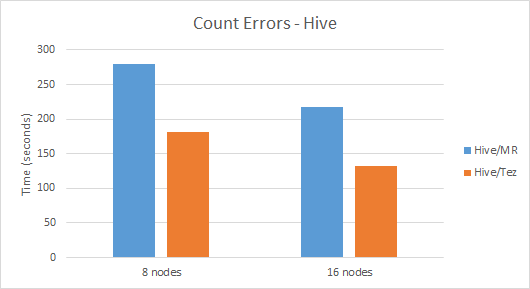
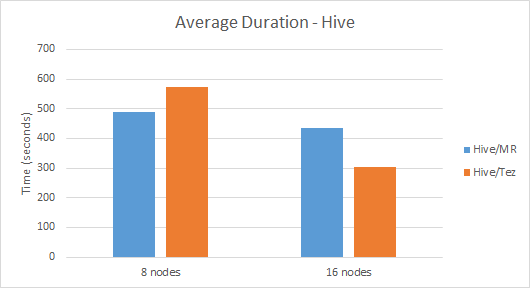
I created two queries for the two business questions above: a simple COUNT() query for what I'll call the "Count Errors" scenario, and an aggregate over self-join query for what I'll call the "Average Duration" scenario. The average elapsed times for those scenarios on unadorned Hive were 280 seconds and 489 seconds respectively (and yes, the results did capture the planted anomalies so I have decent confidence in the correctness). When I created 16-node clusters, the times went down to 218 seconds and 434 seconds, which is an OK speedup but not exactly linear scaling.
So this was unadorned Hive on HDInsight 3.1. But one of the exciting changes that came with HDInsight 3.1 is the introduction of Tez to Hive, which enables a more sophisticated execution engine than plain-old Map-Reduce. It's not on by default, but it's definitely worth trying out. So I changed the execution engine to Tez (SET hive.execution.engine=tez) and tried it out. The results were surprisingly mixed: the best speedup was in the 16-node case in the Average Duration query which was executed in the blazingly fast time of 305 seconds (spoiler alert: this the fastest among all contestants for this scenario). Interestingly though in the 8-node case this scenario was slower, executing in an average of 574 seconds. For the Count Errors scenario the results are more straightforward: Tez sped up the scenario so it executes in about 2/3 the time as Hive-over-Map-Reduce for both 8-nodes and 16-nodes scenarios.
Here is the summary of the Hive/MR (default) and Hive/Tez results:
And in comes the youngest challenger: Presto
And next comes Presto: the youngest entrant in this showdown. Since Presto is a memory-hungry beast, in my basic configuration I had 8 A6 workers (which is the memory-intensive VM at 28GB RAM and 4 cores), a Large coordinator and 1 Small Hive Metastore. I used the same backing SQL Azure DB for the metastore as I did for Hive so I had the same table definition right away, then I used the Presto CLI from my box to issue the queries. I modified the Count Errors and Average Duration queries to match the more ANSI SQL dialect of Presto (I got the same results as Hive, so again I feel good about the correctness of my results).
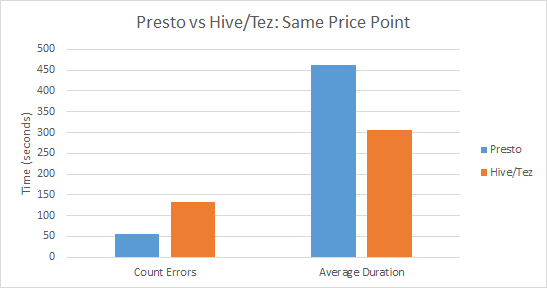
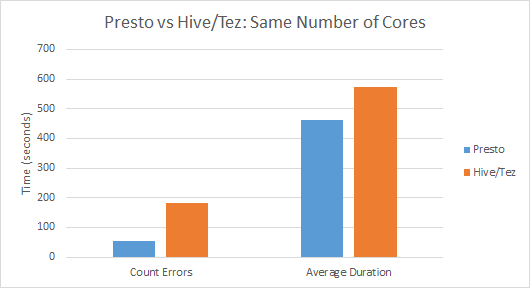
The results were pretty impressive especially on the Count Errors scenario: on 8 nodes, Presto blew away 8-node HDInsight: 55 seconds vs. the best Hive result for 8 nodes which is 182 seconds. But wait: is it fair to compare the 8 A6 nodes Presto got vs. the 8 Large nodes HDInsight uses? I can't give Presto a fair chance with Large nodes, and I can't customize node sizes on HDInsight, so I'm stuck with this apples-to-oranges comparison here. They have the same number of cores, but A6 nodes are about twice the price of Large, so I think the fair comparison is to compare against 16-node HDInsight. Even with that allowance, Presto on the Count Errors scenario strongly wins since the best Hive result there is 133 seconds, still more than twice as slow as Presto's 8-node result.
On the Average Duration scenario, the results are good but less impressive. 8-node Presto executed the query in an average of 462 seconds, which beats 8-node Hive (489 seconds for Hive/MR, 574 seconds for Hive/Tez) but is much slower than 16-node Hive/Tez (305 seconds).
So here is the summary of the rumble of Presto vs. Hive/Tez if we take the same rough price point (8 A6 vs. 16 Large):
And here is the rumble if we take the same number of cores (8 A6 vs. 8 Large):
Note: the results get switched around a bit if it's 16 A6 vs. 16 Large, since at that scale Presto is a bit slower than Hive/Tez on the Average Duration scenario, though it beats it on the Count Errors one.
One more note on Presto: one of the things that don't show here that much that I like about it is that of all the three I'm trying here, it struck me as the most predictable in its perf at different scale points. You've seen the surprising scale results I got out of Hive/Tez and Hive/MR, but with Presto when I tried 4 cores vs. 8 cores vs. 16 cores, on both scenarios I got a nice almost (but not quite) linear scaling in the duration: 150->55->38 on Count Errors, and 66->462->366 on Average Duration. Also, if you look at individual query durations (instead of averages) for each scale point, Presto typically has much less variation at any one scale point.
And finally: our electric Shark!
And now comes my newest and most troublesome addition to Blue Coffee: Spark and Spark SQL/Shark (it's really Spark SQL now, but I just like calling it Shark too much). I have to admit: this took me by far the most effort to get up and running, and even now I'm pretty sure I don't have it running that well. My troubles got much less severe once I moved away from the master branch in Spark (which is way too active/unstable) and the standalone discontinued Shark repository, to the branch-1.1 branch with the packaged Spark SQL there that replaced Shark. However, even after that move I still encountered problems. I think my main performance problems that I haven't fully gotten to the bottom of is in the shuffling of data between nodes (BlockFetcher): I had to bump up a couple of connection timeouts to even get it working on the more complex Average Duration scenario, but it still worked too slow for what it is and I think it comes down to problems there.
For this post, I'm not using Spark's full power: I'm not loading the data first into RDD's, instead just querying them from cold storage directly. As follow-up I hope to experiment with that, but for now since I'm not worrying about loading things into memory I can get away with using Large instances for the workers (instead of A6), so I can compare against HDInsight directly and fairly.
So I provisioned a Spark cluster: 8 Large workers, 1 Small Master node, 1 Large node for the Thrift server and 1 Small Hive Metastore node. Since the Hive metastore is backed by the same Azure DB where my table definitions are already stored, and Spark SQL understads HiveQL, I just launched the same queries I used for Hive from BeeLine from within the cluster (launching them from outside fails because Azure Load Balancer kills my connection after one minute).
The results were pretty bad. On 8 workers Count Errors finishes in 271 seconds which is about the same as Hive/MR 8 nodes but much worse the Hive/Tez or Presto, and Average Duration finishes in 714 seconds which is about 25% slower than the slowest 8-node contender so far (Hive/Tez). The worse news is that on 16 nodes the times hover about the same (on average slight faster but within the variance). I dug into it a tiny bit and it seems to do with my mysterious problem with the performance of fetching blocks among the nodes: since that's slow for whatever reason, exchanging blocks among 16 nodes overwhelms any speed gains from distributing the processing among them. It also doesn't help that by default Spark SQL has spark.sql.shuffle.partitions set to 200 which leads to several stages (especially among the small ORDER BY parts I put in there) to be split among 200 tiny tasks, leading to pretty big unnecesary overheads.
Since this is the least tuned/understood contender for me, I'll refrain from putting summary graphs in here: I fully acknowledge that this needs more work to get a fair chance in the arena, so I don't want anyone skimming this post to get the wrong impression about it from a graph.
So... now what?
My hope is that what you get out of this post isn't the specific performance numbers - since again I didn't tune any of this, and it doesn't qualify as a fair performance benchmark. Instead, what I'm hoping you'll get is:
- the feel for these different data analysis products and what they can do and
- how awesome it is that you can right now choose among all those different options (and more) to analyze your data in Azure!
In that spirit, I'm hoping to go on to expand this to other possibilities, e.g.: how about instead of loading the logs into blobs, the workers directly inserted them into an Elastic Search cluster instead? Would that make the end-to-end scenario easier? Or what if the logs went into Event Hub, and from there were consumed by both a Storm cluster that calculated average durations on the fly, and a spooler that placed the data into Azure blob store? What if the data was placed in blob store in a more sophisticated format (e.g. ORC or Parquet) than CSV? The possibilities are endless and awesome!
Another avenue I'd like to explore is higher scale: go beyond my puny 35 GB data volume here and into the 10's or 100's of TB's scale. It'd be great to see this work, and what I'd need to shard/do to get this scenario working smoothly.