How to use Tableau with SQL Server Machine Learning Services with R and Python
This post is co-authored by Bora Beran , Principal Product Manager at Tableau Software , Bharath Sankaranarayan, Principal Program Manager and Gil Isaacs, Senior Software Engineer from Microsoft Corporation
In this post, I'll be sharing how Tableau and SQL Server Machine Learning Services work seamlessly leveraging the power of R and Python. We like to think of Tableau as the Switzerland of data because of its wide variety of connectivity options. But who said that connecting to a data source meant just reading data from a transactional database or data warehouse? If your database has in-database analytics capabilities, Tableau can take advantage them to supercharge your analysis.
Tableau's integration with R, Python and MATLAB is quite popular due to its platform agnostic nature but if the results from these languages are tables with arbitrary number of rows and columns or if you'd like to save the results in an extract, it wouldn't be the right choice.
SQL Server is the most popular database among Tableau customers and has been building its predictive analytics capabilities over the past two years. SQL Server 2016 added the support to run R code inside the database while SQL Server 2017 extended it to Python. In this post I'll talk about how you can leverage Microsoft SQL Server's R and Python (Microsoft Machine Learning Services) capabilities with Tableau by going through two advanced analytics use cases.
In the first scenario, let's say you'd like to analyze social media data on a daily basis and accumulate data in a Tableau data source, stored in SQL Server to view how well the sentiment towards your topic of interest is changing. You can insert your Python code for this analysis as Initial SQL in your SQL Server data source in Tableau.
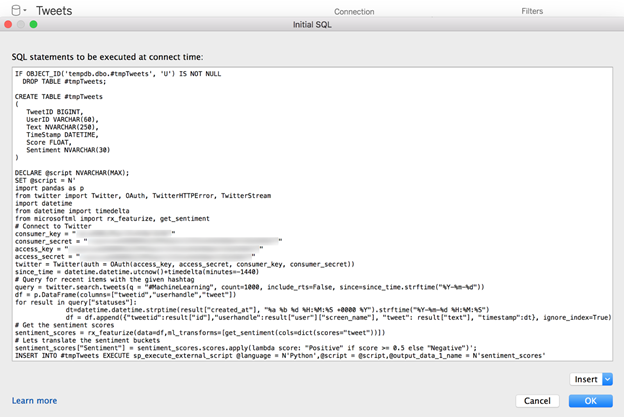
Here is a screenshot of the Initial SQL dialog screenshot showing a code excerpt (the account info is blurred by design).
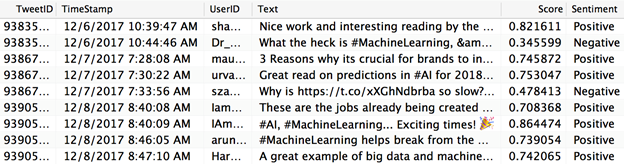
The example leverages SQL Server's integration with Python to retrieve one day's worth of data for the hashtag #MachineLearning from Twitter and then run it through pre-trained sentiment analysis models (pretrained models) provided by Microsoft for use with SQL Server. The result is a table returned to Tableau that includes the original tweet, tweet ID, user handle, date time, and associated sentiment score.
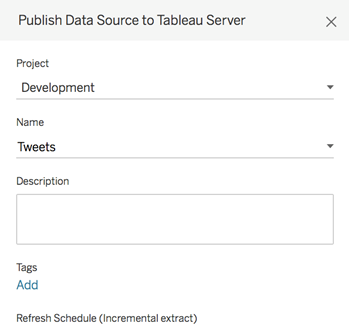
The next step is to run the report on a schedule so that only new data gets appended to historical data. You can do this by publishing this data source to the server with an incremental extract refresh schedule, as seen in the screenshot below.
I can quickly build a visualization using this data source to see the sentiment change over time and see new data and analysis results getting automatically added daily.
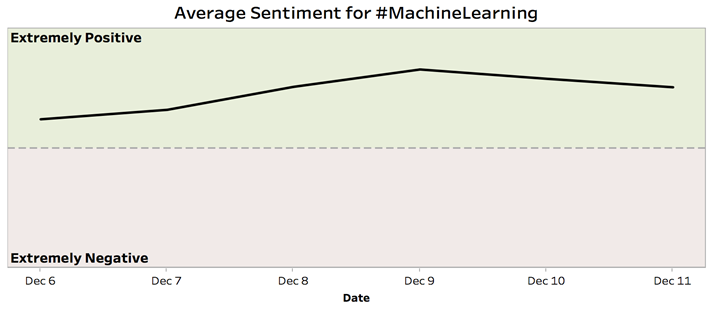
It's no surprise that the sentiment about Machine Learning is positive. You can download the Initial SQL script used in this example here.
In order to get this process to work for you, make sure SQL Server Machine Learning Services and pre-trained models are installed, external script execution is enabled, necessary R (forecast) and Python (Twitter) packages are installed, and "network access for R local user accounts" is not blocked on your database.
In the first example, I was able to insert my code directly into Tableau-which is a great way for ad-hoc use cases. However, businesses often want to use predictive models in production and would prefer exposing them as standardized methods-which in the case of databases often means using stored procedures.
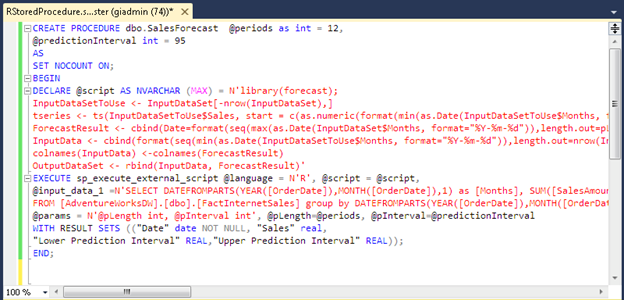
Let's use R in the next example to create a stored procedure with input parameters. This allows consumers of the corresponding visualization in Tableau to customize the output by specifying criteria such as length of the forecast and extent of the prediction bands.
I can create my stored procedure using SQL Server Management Studio as seen in the example below.
You can download the SQL Script for this example from here.
The R user can simply develop the R code and embed this within a stored procedure by keeping the R script intact as seen in the screenshot above.
Once this is done, upon connecting to this database, I can see my stored procedure in the data preparation tab in Tableau. After I drag it into my join diagram and assign inputs the parameters, I am ready to use it in my visualization. The screenshot below shows the stored procedure configuration in Tableau.
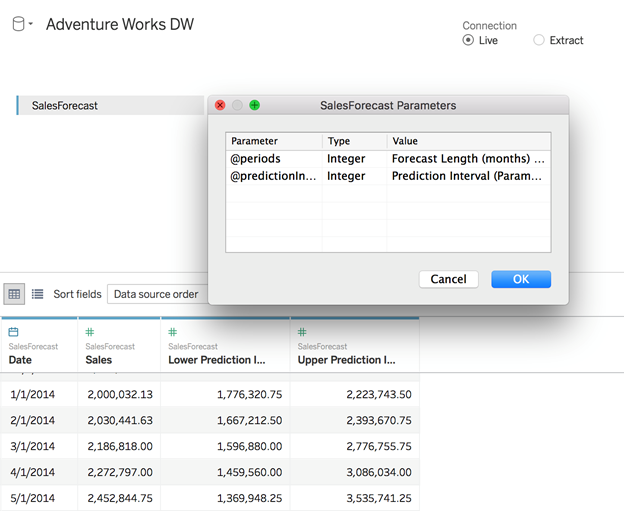
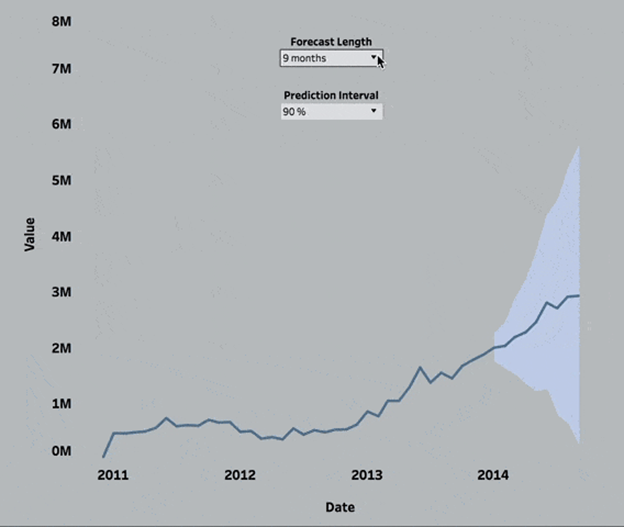
Now I can tweak the parameters and get new forecasts from the database instantly.
This is a quick walkthrough of how you can take advantage of SQL Server Machine Learning Services using R and Python integration in Tableau. Considering the extensive set of machine learning libraries, augmented with Microsoft's own highly performant libraries these languages offer, the possibilities are endless. We're looking forward to seeing what kind of brilliant solutions you will come up with!
SQL Server provides a number of options to configure R or Python or both for use with SQL Server and you can check this out here. In addition, on Azure when you create an instance of SQL Server 2017 including the Developer Edition, by choosing to enable Machine Learning Services your SQL Server VM is created with support for R and Python.
To learn more about how to use Tableau's integration with various technologies most efficiently to solve different business problems, check out the recording for Bora's session at Tableau Conference 2017. To learn more about SQL Server Machine Learning Services you can take a look here.
Bora, Bharath and Gil