Troubleshooting High CPU performance issues - Part 2
In Part 1 of this topic, I explained how to gather the correct data to help diagnose performance issues in IIS web applications that have associated high CPU behavior. To summarize, we need a performance monitor log with the %ProcessorTime data for the Thread and Process objects of W3WP (for IIS6), and at least one memory dump of the problematic W3WP process, both from when the CPU issue is occurring.
Here in Part 2, I'll discuss how to analyze the captured data to pinpoint what the root cause of the issue is. For the purpose of this exercise, I created a simple ASP page that gets stuck in a loop for 100 seconds. Then, I browsed to the page in IIS to re-create the looping behavior. Next I started the Perfmon log using the instructions I outlined in Part 1, let it run, and then captured a memory dump using DebugDiag. As a result I now have a .blg perfmon log and a memory dump file to work with.
Let's start with the perfmon log. We first want to make sure that the perfmon log was captured when the CPU was in fact spiked. This is a good thing to check because if there are multiple people working on gathering the data, and maybe even in different locations, its easy to get data at the wrong time. So we look at the % Processor Time counter of the Process object:

As we can see, this W3WP instance was spiking the CPU while the perfmon was captured. Now that we know the perfmon data is good, we need to get more granular; which thread inside this W3WP was spinning up so much CPU cycles? To verify, we look at the %Processor Time counter of the W3WP thread object instances, as per below:
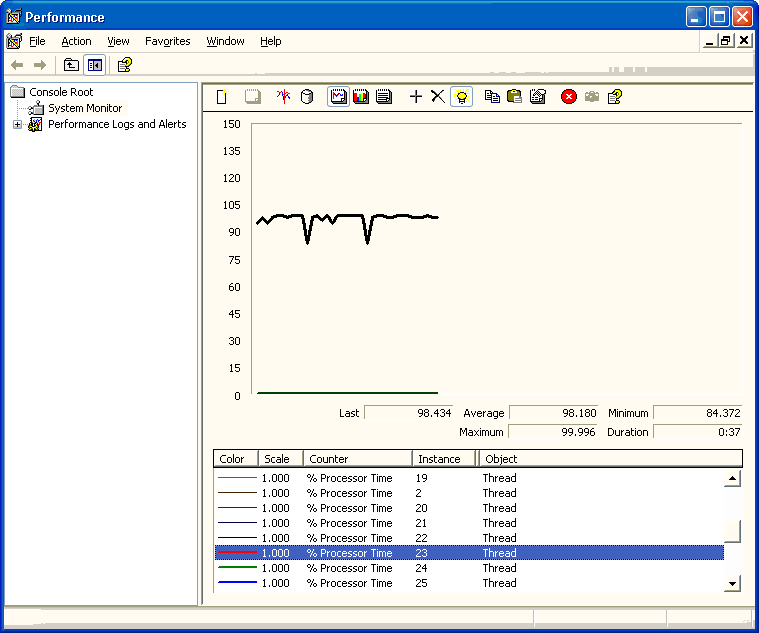
What this image shows us is that out of the more than 25 threads currently alive inside of the W3WP process, only one of them is doing anything significant with CPU cycles. In some scenarios the data may show that multiple threads are using a lot of CPU time, in which case you'll need to look at each corresponding thread in the dump files to see which one or ones are problematic. However for this excercise I made it so that only one thread was doing any request processing, to make it easy for us to zero in on it. And from this we know the one we want to look at is thread instance 23.
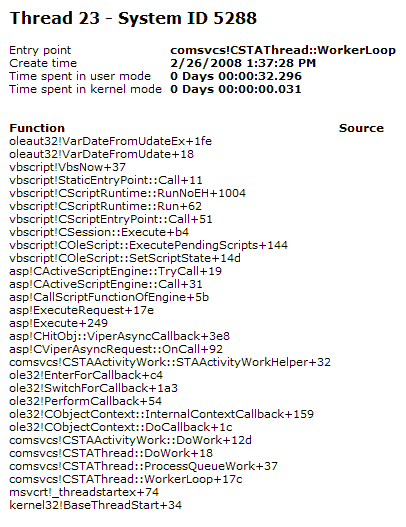
Remember back in Part 1 I introduced you to the Debug Diagnostics tool. Not only does that tool capture dump files for us, but it can also analyze them for commonly known issues! When I ran my dump file through the analyzer, DebugDiag confirmed that thread 23 was using the most CPU time just like PerfMon did:

So what is going on with Thread 23 that it is spinning up the CPU? DebugDiag can help us see. First, we know that Thread 23 is busy processing an incoming ASP request:
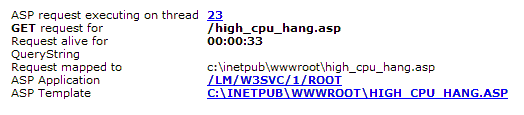
It is not a coincidence that the page is named "high_cpu_hang.asp", I did that on purpose ;) The tool also tells us the request has been alive for 33 seconds, and outlines some ASP application info like the path and the template name.
Knowing what page is spiking the CPU is sometimes enough for the developer of the application to start debugging the problem. But many times it isn't, especially if there are hundreds or thousands of lines of script to dig through. Luckily DebugDiag outputs the callstack info for all of the threads, and for threads that are processing ASP requests it tells us exactly what line of script on the page is currently running:
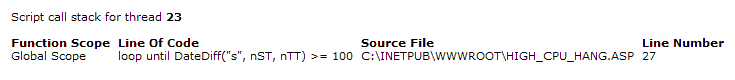
From this we know that Thread 23 is busy processing an ASP script loop on line #27 of high_cpu_hang.asp. The next step would be for the developer of the application to look at the loop and figure out what is wrong. Why has the loop been going on for 33 seconds? Is the loop stuck in infinite iterations, or will the loop eventually end? These types of questions need to be answered. For the purpose of this exercise, I had the loop iterate until the time difference between starttime and curretn time was 100 seconds.
Errant loops are one of the most common causes of High CPU performance problems in ASP applications. Using performance monitor and DebugDiag (or another debugger, like WinDBG) should help you narrow your search to the exact problematic loop.