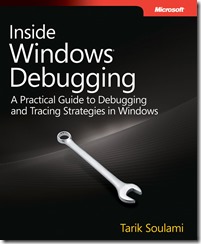
New book: Inside Windows Debugging
 We’re pleased to announce the availability of the new book Inside Windows Debugging: A Practical Guide to Debugging and Tracing Strategies in Windows, by Tarik Soulami. Every once in a while, a technical book breaks new ground—and that’s exactly what this book does. Led by a member of the Windows Fundamentals Team at Microsoft, you’ll discover how to apply the same expert debugging and tracing techniques that Microsoft uses—and sharpen your C++ and C# code analysis skills—through practical examples and common scenarios. Learn why experienced developers use debuggers in every step of the development process, and not just after bugs appear. The complete table of contents appears below.
You can find a sample chapter from the book here: https://www.microsoftpressstore.com/content/images/9780735662780/samplepages/9780735662780.pdf, and purchase the book here: https://www.microsoftpressstore.com/store/inside-windows-debugging-9780735662780.
Part 1: A Bit of Background
Chapter 1 Software Development in Windows
Windows Evolution
Windows Architecture
Windows Developer Interface
Microsoft Developer Tools
Summary
Part II: Debugging for Fun and Profit
Chapter 2 Getting Started
Introducing the Debugging Tools
User-Mode Debugging
Kernel-Mode Debugging
Summary
Chapter 3 How Windows Debuggers Work
User-Mode Debugging
Kernel-Mode Debugging
Managed-Code Debugging
Script Debugging
Remote Debugging
Summary
Chapter 4 Postmortem Debugging
Just-in-Time Debugging
Dump Debugging
Summary
Chapter 5 Beyond the Basics
Noninvasive Debugging
Data Breakpoints
Scripting the Debugger
WOW64 Debugging
Windows Debugging Hooks (GFLAGS)
Summary
Chapter 6 Code Analysis Tools
Static Code Analysis
Runtime Code Analysis
Summary
Chapter 7 Expert Debugging Tricks
Essential Tricks
More Useful Tricks
Kernel-Mode Debugging Tricks
Summary
Chapter 8 Common Debugging Scenarios, Part 1
Debugging Access Violations
Debugging Heap Corruptions
Debugging Stack Corruptions
Debugging Stack Overflows
Debugging Handle Leaks
Debugging User-Mode Memory Leaks
Debugging Kernel-Mode Memory Leaks
Summary
Chapter 9 Common Debugging Scenarios, Part 2
Debugging Race Conditions
Debugging Deadlocks
Debugging Access-Check Problems
Summary
Chapter 10 Debugging System Internals
The Windows Console Subsystem
Anatomy of System Calls
Summary
Part III: Observing and Analyzing Software Behavior
Chapter 11 Introducing Xperf
Acquiring Xperf
Your First Xperf Investigation
Xperf’s Strengths and Limitations
Summary
Chapter 12 Inside ETW
ETW Architecture
Existing ETW Instrumentation in Windows
Understanding ETW Stack-Walk Events
Adding ETW Logging to Your Code
Boot Tracing in ETW
Summary
Chapter 13 Common Tracing Scenarios
Analyzing Blocked Time
Analyzing Memory Usage
Tracing as a Debugging Aid
Summary
Appendix WinDbg User-Mode Debugging Quick Start
Starting a User-Mode Debugging Session
Fixing the Symbols Path
Fixing the Sources Path
Displaying the Command Line of the Target Process
Control Flow Commands
Listing Loaded Modules and Their Version
Resolving Function Addresses
Setting Code (Software) Breakpoints
Setting Data (Hardware) Breakpoints
Switching Between Threads
Displaying Call Stacks
Displaying Function Parameters
Displaying Local Variables
Displaying Data Members of Native Types
Navigating Between Call Frames
Listing Function Disassembly
Displaying and Modifying Memory and Register Values
Ending a User-Mode Debugging Session
Appendix WinDbg Kernel-Mode Debugging Quick Start
Starting a Kernel-Mode Debugging Session
Switching Between CPU Contexts
Displaying Process Information
Displaying Thread Information
Switching Process and Thread Contexts
Listing Loaded Modules and Their Version
Setting Code (Software) Breakpoints Inside Kernel-Mode Code
Setting Code (Software) Breakpoints Inside User-Mode Code
Setting Data (Hardware) Breakpoints
Ending a Kernel-Mode Debugging Session