New book: Windows Sysinternals Administrator’s Reference
Gang, Windows Sysinternals Administrator’s Reference , by Mark Russinovich and Aaron Margosis, is available! (Congratulations, guys!)
In this post, first we’ll offer some words about the book from Mark (from his blog), and then we’ll follow that with an excerpt from the book.
Mark says:
“Aaron Margosis and I are thrilled to announce that the long awaited, and some say long overdue, official guide to the Sysinternals tools is now available! I’ve always had the idea of writing a book on the tools in the back of my mind, but it wasn’t until a couple of years ago that Dave Solomon, my coauthor on Windows Internals, convinced me to pursue it. After a few false starts, I decided that a coauthor would help get the book done more quickly, and turned to Aaron, a good friend of mine who’s also a long-time user and expert on the tools at his day job in the Federal Division of Microsoft Consulting Services. It was a great choice and I’m proud to put the Sysinternals brand on the book.
Whether you’re new to the tools or have been using them since Bryce Cogswell (my Sysinternals and Winternals Software cofounder, now retired) and I released NTFSDOS in 1996, you’re sure to take away new insights that will give you the edge when tackling tough problems and managing your Windows systems.
The book covers all 70+ tools, with chapters dedicated to the major tools like Process Explorer, Process Monitor, and Autoruns. For each we provide a thorough tour of all of the tool’s features, how to use the tool, and include our favorite tips and techniques. There’s no better way to learn than by example, though. The last section of the book will be familiar to anyone that’s read this blog or watched my Case of the Unexplained conference sessions, because it presents 17 real-world cases that show how Windows power users and administrators like you solved otherwise impossible-to-solve problems by using the tools.
The book is available for purchase on Amazon.com and available from O'Reilly in 4 ebook formats, or you can read it online through Safari.
The eBook has only been out for a couple of weeks and we’ve already heard from someone who bought the book and immediately used what he learned to solve a case that was literally ruining his sleep. I thought it only appropriate to include it here in the blog post announcing the book.
Let us know what you think of the book by dropping us an email, and as I say my dedication to you - my fellow Windows troubleshooters - at the front of the book, never give up, never surrender!”
And here’s a taste of the book. In the book, the “VMMaP” section is completed (after the text in this excerpt) by sections titled “Timeline and Snapshots,” “Viewing Text Within Memory Regions,” “Finding and Copying Text,” “Viewing Allocations from Instrumented Processes,” “Address Space Fragmentation,” “Saving and Loading Snapshot Results,” “VMMap Command-Line Options,” and “Restoring VMMap Defaults.”
Chapter 7
Process and Diagnostic Utilities
Process Explorer and Process Monitor, discussed in Chapters 3 and 4, respectively, are the
primary utilities for analyzing the runtime behavior and dynamic state of processes and of
the system as a whole. This chapter describes six additional Sysinternals utilities for viewing
details of process state:
■ VMMap is a GUI utility that displays details of a process’s virtual and physical memory
usage.
■ ProcDump is a console utility that can generate a memory dump for a process when
it meets specifiable criteria, such as exhibiting a CPU spike or having an unresponsive
window.
■ DebugView is a GUI utility that lets you monitor user-mode and kernel-mode debug
output generated from either the local computer or a remote computer.
■ LiveKd lets you run a standard kernel debugger on a snapshot of the running local
system without having to reboot into debug mode.
■ ListDLLs is a console utility that displays information about DLLs loaded on the system.
■ Handle is a console utility that displays information about object handles held by
processes on the system.
VMMap
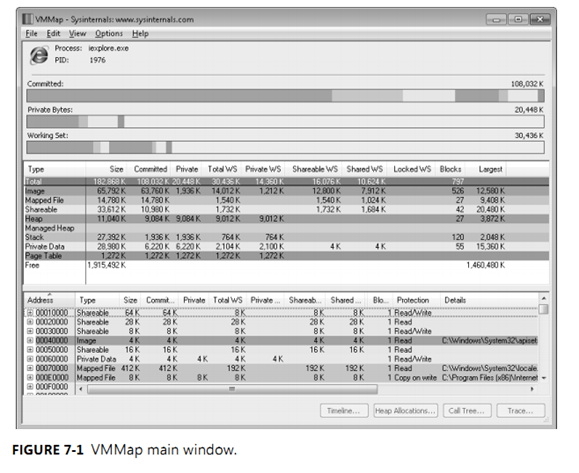
VMMap (shown in Figure 7-1) is a process virtual and physical memory analysis utility. It
shows graphical and tabular summaries of the different types of memory allocated by a
process, as well as detailed maps of the specific virtual memory allocations, showing char-
acteristics such as backing files and types of protection. VMMap also shows summary and
detailed information about the amount of physical memory (working set) assigned by the
operating system for the different virtual memory blocks.
VMMap can capture multiple snapshots of the process’s memory allocation state, graphically
display allocations over time, and show exactly what changed between any two points in
time. Combined with VMMap’s filtering and refresh options, this allows you to identify the
sources of process memory usage and the memory cost of application features.
VMMap can also instrument a process to track its individual memory allocations and
show the code paths and call stacks where those allocations are made. With full symbolic
information, VMMap can display the line of source code responsible for any memory
allocation.
Besides flexible views for analyzing live processes, VMMap supports the export of data in
multiple formats, including a native format that preserves detailed information so that you
can load it back into VMMap at a later time. It also includes command-line options that
enable scripting scenarios.
VMMap is the ideal tool for developers who want to understand and optimize their
application’s memory resource usage. (To see how Microsoft Windows allocates physical
memory as a systemwide resource, see RAMMap, which is described in Chapter 14, “System
Information Utilities.”) VMMap runs on x86 and x64 versions of Windows XP and newer.
Starting VMMap and Choosing a Process
The first thing you must do when starting VMMap is to pick a process to analyze. If you
don’t specify a process or an input file on the VMMap command line (described later in this
chapter), VMMap displays its Select or Launch Process dialog box. Its View A Running Process
tab lets you pick a process that is already running, and the Launch And Trace A New Process
tab lets you start a new, instrumented process and track its memory allocations. You can
display the Select or Launch Process dialog box at a later time by pressing Ctrl+P.
View a Running Process
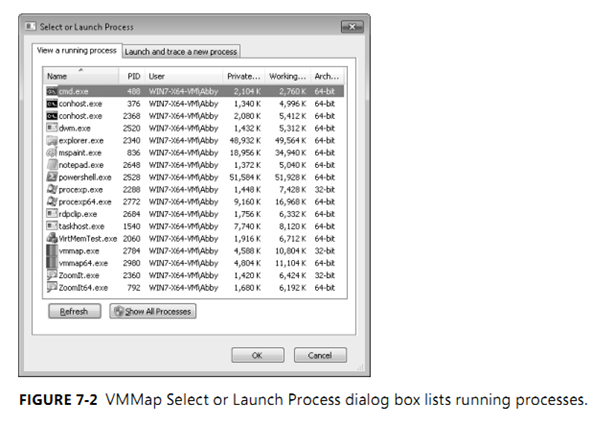
Select a process from the View A Running Process tab (shown in Figure 7-2), and click OK. To
quickly find a process by process ID (PID) or by memory usage, click on any column header
to sort the rows by that column. The columns include User, Private Bytes, Working Set, and
Architecture (that is, whether the process is 32-bit or 64-bit). Click Refresh to update the list.
The View A Running Process tab lists only processes that VMMap can open. If VMMap is not
running with administrative permissions (including the Debug privilege), the list includes only
processes running as the same user as VMMap and at the same integrity level or a lower one.
On Windows Vista and newer, you can restart VMMap with elevated rights by clicking the
Show All Processes button in the dialog box, or by choosing File | Run As Administrator.
On x64 editions of Windows, VMMap can analyze 32-bit and 64-bit processes. VMMap
launches a 32-bit version of itself to analyze 32-bit processes and a 64-bit version to analyze
64-bit processes. (See “Single Executable Image” in Chapter 1, “Getting Started with the
Sysinternals Utilities,” for more information.) With the –64 command-line option, described
later in this chapter, the 64-bit version is used to analyze all processes.
Launch and Trace a New Process
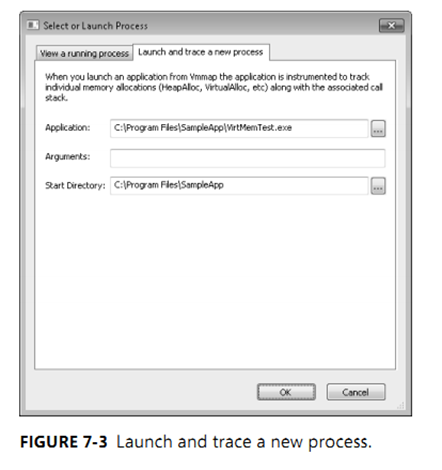
When you launch an application from VMMap, the application is instrumented to track all
individual memory allocations along with the associated call stack. Enter the path to the
application and optionally any command-line arguments and the start directory as shown in
Figure 7-3, and then click OK.
VMMap injects a DLL into the target process at startup and intercepts its virtual memory
API calls. Along with the allocation type, size, and memory protection, VMMap captures the
call stack at the point when the allocation is made. VMMap aggregates this information in
various ways, which are described in the “Viewing Allocations from Instrumented Processes”
section later in this chapter. (See “Call Stacks and Symbols” in Chapter 2, “Windows Core
Components,” for more information.)
On x64 editions of Windows, VMMap can instrument and trace x86 and x64 programs,
launching a 32-bit or 64-bit version of itself accordingly. However, on x64 Windows VMMap
cannot instrument and trace .NET programs built for “Any CPU.” It can instrument those pro-
grams on 32-bit versions of Windows, and you can analyze an “Any CPU” program on x64
without instrumentation by picking it from the View A Running Process tab of the Select or
Launch Process dialog box.
Note “Any CPU” is the default target architecture for Microsoft C# and Visual Basic .NET
applications built with Microsoft Visual Studio 2005 and newer.
The VMMap Window
After you select or launch a process, VMMap analyzes the process, displaying graphical
representations of virtual and physical memory, and tabular Summary and Details Views.
Memory types are color coded in each of these components, with the Summary View also
serving as a color key.
The first bar graph in the VMMap window (shown in Figure 7-1) is the Committed summary.
Its differently-colored areas show the relative proportions of the different types of
committed memory within the process’s address space. It also serves as the basis against
which the other two graphs are scaled. The total figure shown above the right edge of the
graph is not all allocated memory, but the process’s “accessible” memory. Regions that have
only been reserved cannot yet be accessed and are not included in this graph. In other
words, the memory included here is backed by RAM, a paging file, or a mapped file.
The second bar graph in the VMMap window is the Private Bytes summary. This is process
memory not shareable with other processes and that’s backed by physical RAM or by a
paging file. It includes the stack, heaps, raw virtual memory, page tables, and read/write
portions of image and file mappings. The label above the right side of the graph reports
the total size of the process’s private memory. The colored areas in the bar graph show the
proportions of the various types of memory allocations contributing to the private byte
usage. The extent of the colored areas toward the graph’s right edge indicates its proportion
to in-use virtual memory.
The third bar graph shows the working set for the process. The working set is the process’s
virtual memory that is resident in physical RAM. Like the Private Bytes graph, the colored
areas show the relative proportions of different types of allocations in RAM, and their extent
toward the right indicates the proportion of the process’ committed virtual memory that is
resident in RAM.
Note that these graphs show only the relative proportions of the different allocation types.
They are not layout maps that show where in memory they are allocated. The Address Space
Fragmentation dialog box, described later in this chapter, provides such a map for 32-bit
processes.
Below the three graphs, the Summary View table lists the different types of memory
allocations (described in the “Memory Types” section in this chapter), the total amount of
each type of allocation, how much is committed, and how much is in physical RAM. Select
a memory type in Summary View to filter what is shown in the Details View window. You
can sort the Summary View table by the values in any column by clicking the corresponding
column header. Clicking a column header again reverses the sort order for that column. The
order of the colored areas in the VMMap bar graphs follows the sort order of the Summary
View table. You can also change the column order for this table by dragging a column
header to a new position, and resize column widths by dragging the borders between the
column headers.
Below Summary View, Details View displays information about each memory region of the
process’ user-mode virtual address space. To show only one allocation type in Details View,
select that type in the Summary View. To view all memory allocations, select the Total row
in the Summary View. As with the Summary View, the columns in Details View allow sorting,
resizing and reordering.
Allocations shown in Details View can expand to show sub-blocks within the original
allocation. This can occur, for example, when a large block of memory is reserved, and then
parts of it are committed. It also occurs when the image loader or an application creates a
file mapping and then creates multiple mapped views of that file mapping; for example, to
set protection differently on the different regions of the file mapping. You can expand or
collapse individual groups of sub-allocations by clicking the plus (+) and minus (–) icons in
Details View. You can also expand or collapse all of them by choosing Expand All or Collapse
All from the Options menu. The top row of such a group shows the sums of the individual
components within it. When a different sort order is selected for Details View, sub-blocks
remain with their top-level rows and are sorted within that group.
If VMMap’s default font is not to your liking, choose Options | Font to select a different font
for Summary View, Details View, and some of VMMap’s dialog boxes.
Memory Types
VMMap categorizes memory allocations into one of several types:
■ Image The memory represents an executable file, such as an EXE or DLL, that has
been loaded into a process by the image loader. Note that Image memory does not
include executable files loaded as data files—these are included in the Mapped File
memory type. Executable code regions are typically read/execute-only and shareable.
Data regions, such as initialized data, are typically read/write or copy-on-write. When
copy-on-write pages are modified, additional private memory is created in the process
and is marked as read/write. This private memory is backed by RAM or a paging file
and not by the image file. The Details column in Details View shows the file’s path or
section name.
■ Mapped File The memory is shareable and represents a file on disk. Mapped files are
often resource DLLs and typically contain application data. The Details column shows
the file's path.
■ Shareable Shareable memory is memory that can be shared with other processes
and is backed by RAM or by the paging file (if present). Shareable memory typically
contains data shared between processes through DLL shared sections or through
pagefile-backed, file-mapping objects (also known as pagefile-backed sections).
■ Heap A heap represents private memory allocated and managed by the user-mode
heap manager and typically contains application data. Application memory allocations
that use Heap memory include the C runtime malloc library, the C++ new operator, the
Windows Heap APIs, and the legacy GlobalAlloc and LocalAlloc APIs.
■ Managed Heap Managed Heap represents private memory that is allocated and
managed by the .NET runtime and typically contains application data.
■ Stack Stack memory is allocated to each thread in a process to store function
parameters, local variables, and invocation records. Typically, a fixed amount of Stack
memory is allocated and reserved when a thread is created, but only a relatively small
amount is committed. The amount of memory committed within that allocation will
grow as needed, but it will not shrink. Stack memory is freed when its thread exits.
■ Private Data Private Data memory is memory that is allocated by VirtualAlloc and
that is not further handled by the Heap Manager or the .NET runtime, or assigned to
the Stack category. Private Data memory typically contains application data, as well as
the Process and Thread Environment Blocks. Private Data memory cannot be shared
with other processes.
Note VMMap’s definition of “Private Data” is more granular than that of Process
Explorer’s “private bytes.” Procexp’s “private bytes” includes all private committed memory
belonging to the process.
■ Page Table Page Table memory is private kernel-mode memory associated with the
process’ page tables. Note that Page Table memory is never displayed in VMMap’s
Details View, which shows only user-mode memory.
■ Free Free memory regions are spaces in the process’s virtual address space that are
not allocated. To include free memory regions in Details View when inspecting a
process’s total memory map, choose Options | Show Free Regions.
Memory Information
Summary View and Details View show the following information for allocation types and in-
dividual allocations. To reduce noise in the output, VMMap does not show entries that have a
value of 0.
■ Size The total size of the allocated type or region. This includes areas that have been
reserved but not committed.
■ Committed The amount of the allocation that is committed—that is, backed by RAM,
a paging file, or a mapped file.
■ Private The amount of the allocation that is private to the process.
■ Total WS The total amount of working set (physical memory) assigned to the type or
region.
■ Private WS The amount of working set assigned to the type or region that cannot be
shared with other processes.
■ Shareable WS The amount of working set assigned to the type or region that can be
shared with other processes.
■ Shared WS The amount of Shareable WS that is currently shared with other processes.
■ Locked WS The amount of memory that has been guaranteed to remain in physical
memory and not incur a page fault when accessed.
■ Blocks The number of individually allocated memory regions.
■ Largest In Summary View, the size of the largest contiguous memory block for that
allocation type.
■ Address In Details View, the base address of the memory region in the process’s
virtual address space.
■ Protection In Details View, identifies the types of operations that can be performed
on the memory. In the case of top-level allocations that show expandable sub-blocks,
Protection identifies a summary of the types of protection in the sub-blocks. An access
violation occurs on an attempt to execute code from a region not marked Execute (if
DEP is enabled), to write to a region not marked Write or Copy-on-Write, or to access
memory that is marked as no-access or is only reserved but not yet committed.
■ Details In Details View, additional information about the memory region, such as the
path to its backing file, Heap ID (for Heap memory), Thread ID (for Stack memory), or
.NET AppDomain and Garbage Collection generations.
Note The VirtualProtect API can change the protection of any page to something different from
that set by the original memory allocation. This means that there can potentially be pages of
memory private to the process in a shareable memory region, for instance, because the region
was created as a pagefile-backed section, but then the application or some other software
changed the protection to copy-on-write and modified the pages.


