RTM’d today: Microsoft Excel 2010 Inside Out
We’re pleased to announce the release of Microsoft Excel 2010 Inside Out to the printer. This book will be available for purchase soon, but for now you can take a look at the contents and an excerpt from Chapter 1.
Contents
Part 1: Examining the Excel Environment
Chapter 1 What’s New in Microsoft Excel 2010
Chapter 2 Exploring Excel Fundamentals
Chapter 3 Custom-Tailoring the Excel Workspace
Part 2: Building Worksheets
Chapter 5 Planning Your Worksheet Design
Chapter 6 How to Work a Worksheet
Chapter 7 How to Work a Workbook
Part 3: Formatting and Editing Worksheets
Chapter 8 Worksheet Editing Techniques
Chapter 9 Worksheet Formatting Techniques
Part 4: Adding Graphics and Printing
Chapter 10 Creating and Formatting Graphics
Chapter 11 Printing and Presenting
Part 5: Creating Formulas and Performing Data Analysis
Chapter 12 Building Formulas
Chapter 13 Using Functions
Chapter 14 Everyday Functions
Chapter 15 Formatting and Calculating Date and Time
Chapter 16 Functions for Financial Analysis
Chapter 17 Functions for Analyzing Statistics
Chapter 18 Performing What-If Analysis
Part 6: Creating Charts
Chapter 19 Basic Charting Techniques
Chapter 20 Using Sparklines
Chapter 21 Advanced Charting Techniques
Part 7: Managing Databases and Tables
Chapter 22 Managing Information in Tables
Chapter 23 Analyzing Data with PivotTable Reports
Chapter 24 Working with External Data
Part 8: Collaborating
Chapter 25 Collaborating on a Network or by E-Mail
Chapter 26 Collaborating Using the Internet
Part 9: Automating Excel
Chapter 27 Recording Macros
Chapter 28 Creating Custom Functions
Chapter 29 Debugging Macros and Custom Functions
Part 10: Integrating Excel with Other Applications
Chapter 30 Using Hyperlinks
Chapter 31 Linking and Embedding
Chapter 32 Using Excel Data in Word Documents
Appendixes
Appendix A Menu to Ribbon Command Reference
Appendix B Keyboard Shortcuts
Appendix C Function Reference
Chapter 1 What’s New in Microsoft Excel 2010
Over the years, Microsoft has devoted considerable resources to usability research,
including a suite of onsite laboratories, which has contributed innumerable incremental
changes to the ease of use, functionality, and appearance of Microsoft
Office. The 2007 release truly marked a paradigm shift—the most significant change since
Office 95. For those who are wary of change, Office 2010 is a significant refinement; the
beta was widely distributed, heavily tested, and well behaved. So if you—out of fear, prudence,
or thrift—have been waiting for the next version, the waiting was the hardest part.
New and Improved for 2010
First, we’ll highlight the new features in the 2010 release of Microsoft Excel. Later, we’ll talk
about features that have been “retired” from the program and summarize the features that
will be new to you if you skipped the last upgrade or two.
Backstage View
Users of Excel 2007 had to adjust to the Microsoft Office Button replacing the File menu,
but in Excel 2010, the File tab replaces the Office Button, so the File menu is kind of back,
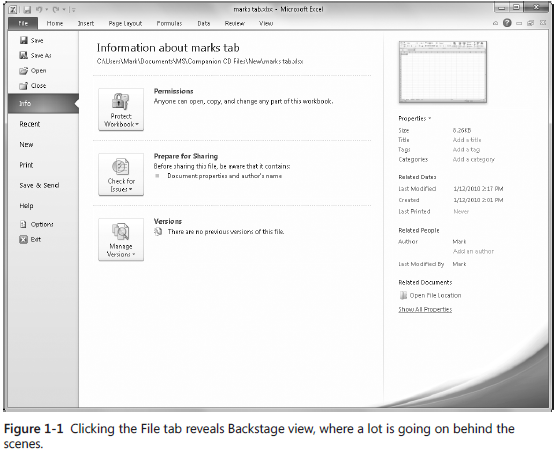
but there’s a lot more going on there now. The new File tab opens what Microsoft calls
Backstage view, a single location where you find essential controls and information about
your documents and where most of Excel’s behind-the-scenes options and settings reside.
The traditional File menu commands are here, too—for opening, saving, and creating new
files; using templates; printing; and sharing information with others. Click the File tab on
the ribbon to open Backstage view, shown in Figure 1-1. The features contained in Backstage
view are discussed throughout the book, but for more, see “Introducing Backstage
View” on page 41.
Ribbon Customization
Users of the static ribbon in Excel 2007 will be happy to know that Excel 2010 allows you
to create your own, as shown in Figure 1-2. You can freely rearrange command groups;
change the order and position of tabs; remove groups; create custom commands, groups,
and tabs; and show or hide existing tabs. For more information, see “Customizing the Ribbon”
on page 83.
Sparklines
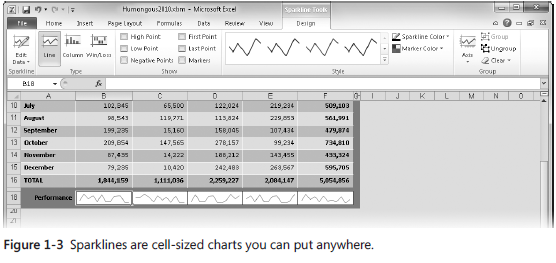
Sparklines are tiny charts that fit within a cell and give you a visual summary alongside
your data, as shown in Figure 1-3. To create one, click the Insert tab and click one of the
buttons in the Sparklines group to get started. See Chapter 20, “Using Sparklines,” for more
information.
Paste Preview
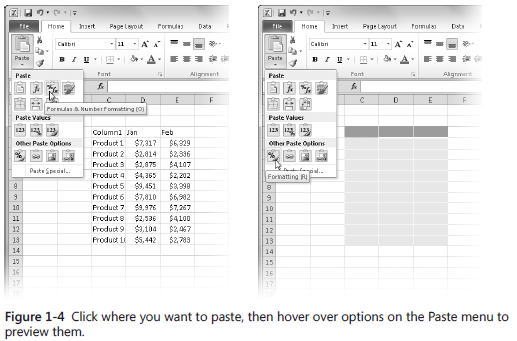
For those who feel that the ability to undo an action isn’t quite enough, Excel now allows
you to preview how copied information will look before you paste it. Copy, click where you
intend to paste in the workbook, click the Paste menu (on the Home tab in the Clipboard
group), hover over the option buttons (as shown in Figure 1-4), and watch what each one
will do if you actually click it. You can also right-click where you want to paste, and the
shortcut menu that pops up displays applicable paste option buttons that exhibit the same
live preview functionality. Make a selection, and click to paste. For more information, see
“Previewing Before You Paste” on page 199.
Improved Picture Editing
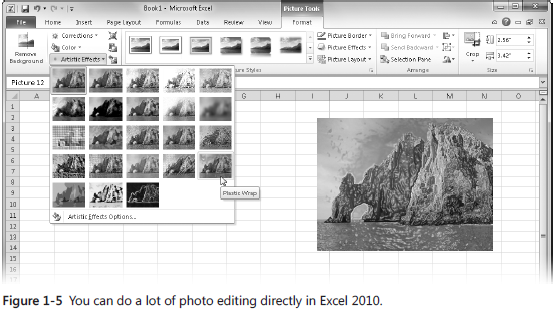
Now when you want to insert a picture in a workbook, you can edit it directly in Excel
2010—you no longer need to prepare it in advance using a photo-editing program. After
you insert a picture (Insert tab, Picture button), the Picture Tools tab appears whenever the
picture is selected, as shown in Figure 1-5.
Office Web Apps
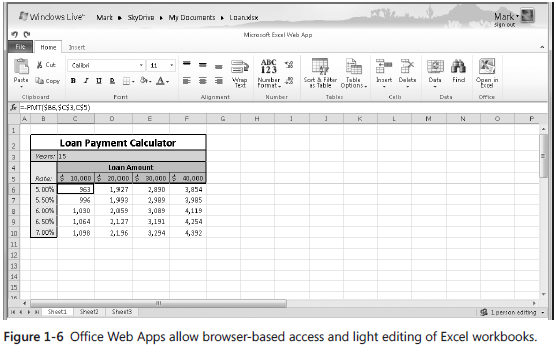
Providing a familiar Microsoft Office experience when you are away from your computer,
Office Web Apps allow you to work with Excel, Word, PowerPoint, and OneNote files
from just about anywhere through browser-based viewing and lightweight editing. Office
Web Apps, shown in Figure 1-6, are available in various flavors through both free and fee
accounts on Windows Live, Hotmail, SharePoint, and other online portals. For more information,
see Chapter 26, “Collaborating Using the Internet.”
Slicers
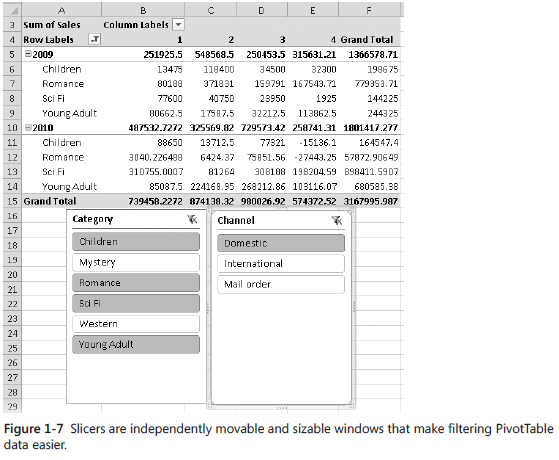
Slicers, a new addition to the PivotTable interface, provide an easier way to drill down
through large PivotTables so that you can see exactly the data you need without being distracted
by data you don’t need. A single slicer can be connected to more than one table,
which means that if you set up a group of PivotTables to display a common set of data from
multiple perspectives, you can use a single slicer to change the filter for all related tables at
once. For more information, see “Filtering with Slicers”.
Improved Conditional FormattingNew conditional formatting options let you quickly visualize and comprehend data. You will
find more styles, icons, and data bars, and you now have the ability to highlight specified
items (such as the maximum or minimum value) in a few clicks. In the Styles group on the
Home tab, click Conditional Formatting. For more information, see “Formatting Conditionally”
on page 309.
New Functions and Functional Consistency
Microsoft added a number of statistical and financial functions that extend or refine existing
functionality. These functions have been added largely to conform to standard industry
practices—and perhaps to increase formula readability a bit. All “legacy” versions of
the updated functions remain fully supported and are listed in the Help table of contents
as “Compatibility Functions” under the Function Reference heading. You’ll know exactly
which functions are new because they are all “dotted” forms with a mid-period, such as
CEILING.PRECISE.
Most of the new functions are statistical distribution functions. For example, the COVAR
function, a measure of deviation between data sets, has been replaced by COVARIANCE.P
and COVARIANCE.S, which apply to an entire population of data (P) or a representative
sample (S). The original COVAR function is still included and works fine, of course. Most of
these new functions are discussed in Chapter 17, “Functions for Analyzing Statistics.”
Improved Math Equation Support
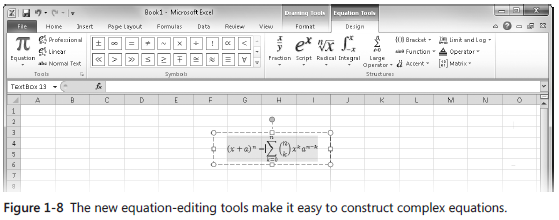
Create and display math equations with the rich set of equation-editing tools in Excel 2010.
On the Insert tab, in the Symbols group, click Equation to insert a new equation and activate
the Equation Tools Design tab shown in Figure 1-8. If you click the arrow adjacent to
the Equation button (which also appears on the Equation Tools Design tab), you can select
from a group of preconstructed equations (including the binomial theorem equation shown
in Figure 1-8) as a starting point.

