Guest post: Donis Marshall on the Visual Studio Profiler
Donis here. After completing Solid Code(Microsoft Press, 2009; ISBN: 9780735625921; 625 pages), I realized that some meritorious topics were omitted. (Actually, I realize this after finishing every book.) One of those topics is the Visual Studio Profiler, and blogging is an excellent opportunity to talk about other worthy topics, so here goes!
A great chapter written by my coauthor John Bruno, Chapter 4 of Solid Code is “Performance Is a Feature.” The Visual Studio Profiler is a tool for analyzing performance and an excellent feature of Visual Studio. It assembles performance data of a managed or native application. This data is then presented in a variety of views for your analysis. The Visual Studio Profiler is a superb tool for detecting bottlenecks, inefficient algorithms, and other performance-related problems in an application.
Use the Visual Studio Profiler throughout the Software Development Life Cycle to monitor milestones and benchmarks. Early on, set performance benchmarks or milestones with acceptable deviations. Include performance profiling in the weekly build to detect possible problems. Performance problems can be an indicator of larger problems. Scenarios should be created to test potential bottlenecks and hot paths. You want to find this out as soon as possible. If not, you may have to undertake an expensive rewrite.
My interest in writing about the Visual Studio Profiler began for the usual reason – frustration. With deference to others, I could not find a complete and concise tutorial for the Visual Studio Profiler. That is my objective here. Let me know if I am successful. I use Visual Studio Team System 2008 in this blog post. Although the Visual Studio Profiler is available for native programs (C/C++), this post is written from the perspective of a managed application (C#).
The Visual Studio Profiler monitors target assemblies and collects performance data. There are two methods for collecting performance data: sampling and instrumentation. With sampling, the target assembly is interrupted periodically during execution to collect information on the call stack and other relevant performance data. With instrumentation, probes are inserted at the entry point of a function, exit point of a function, and around call sites for external functions. Probing is more intrusive than sampling but allows additional data to be collected via instrumentation. In addition, performance of the target assembly can be noticeably affected.
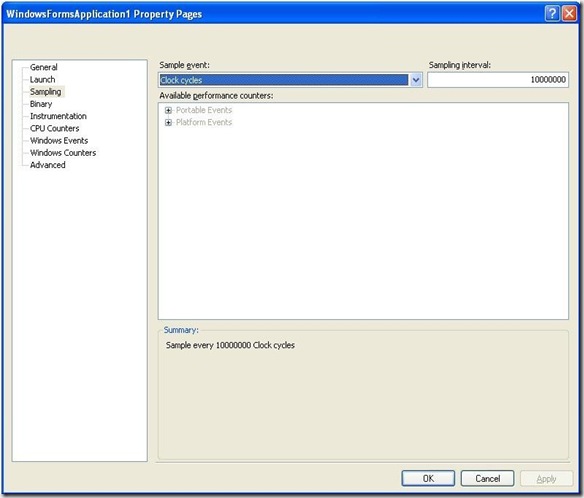
Sampling occurs on clock cycles and certain events, such as a page fault. This is configurable in the Visual Studio Profiler properties (see Figure 1) for the target application. You can open the properties from the Performance Explorer. Use the context menu for the performance session and choose Properties. The method for profiling collection is found in the General window.
Figure 1
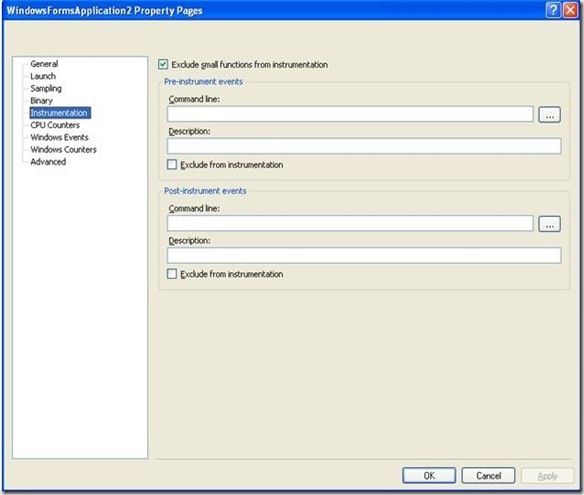
Small functions tend to have little impact on the overall performance of the application. In addition, reporting on small functions, particularly when they are plentiful, can distract from relevant performance data. For that reason, the Visual Studio Profiler does not collect data on small functions as a default. A small function is defined as a function that is short and does not call other functions. If you want to include small functions in the analysis, including small functions is set in the properties for the performance session. Select the Instrumentation window. To include small functions, unselect the Exclude Small Functions from instrumentation checkbox. See Figure 2.
Figure 2
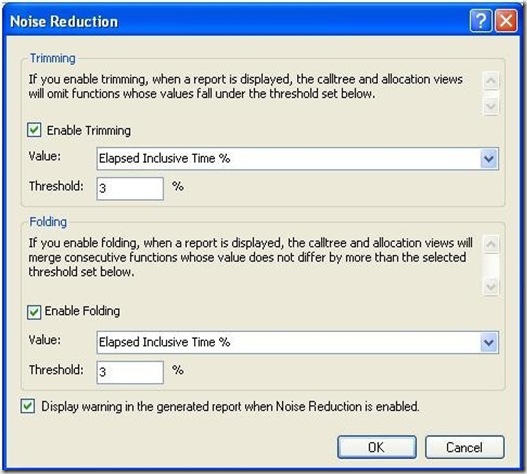
Similar to the Small Function option, the Noise Reduction feature helps filter irrelevant data. After profiling an application, the Visual Studio Profiler presents several reports. For some of these reports, the sheer amount of data may abstract an underlying performance problem. To prevent this problem, Noise Reduction is an option available for the Call Tree and Allocation view. This option reduces the amount of data included in either view. You can configure Noise Reduction using Trimming and/or Folding. With trimming, functions can be removed from the Call Tree and Allocation reports based on certain thresholds being reached, such as Elapsed Inclusive Time. With folding, consecutive functions are combined (folded) if they do not differ by a performance criteria. Both Trimming and Folding are enabled by default.
Select either the Call Tree or Allocation view before configuring Noise Reduction. From the Menu, choose Analyze and the Profiler submenu. From the submenu, select Noise Reduction Options and a dialog box will be presented. The dialog box is shown in Figure 3. You can then enable and configure Trimming and Folding.
Figure 3
The Visual Studio Profiler collects data and generates reports. You however must analyze this data to isolate any problems. Have fun! This is where the Hot Path feature can be helpful. It can perform some of the analysis for you. The Hot Path feature will highlight the hot path (the most expensive inclusive functions) through the call stack. When viewing the Call Tree view, the Expand Hot Path button appears on the report toolbar, which is shown in Figure 4. It is the button with the flame icon (one of my favorite icons). Pressing the button will expand the Call Tree view to expose the hot path of the application. Beforehand, you can select a function to start the analysis from that point in the call stack.
Figure 4
Enough of the setup and configuration stuff! How do you actual start a Visual Studio performance profiling session? Fortunately, there is a wizard. You can start a performance session from within an open project or without a project. After making that decision, select Launch Performance Wizard from the Analyze menu. That will start the wizard.
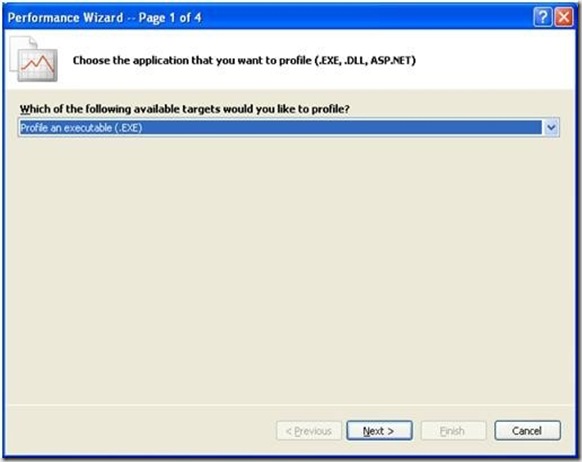
If a project is opened, the wizard has four pages. Select the target for profiling: executable, dynamic library, or ASP.NET on Page 1. See Figure 5.
Figure 5
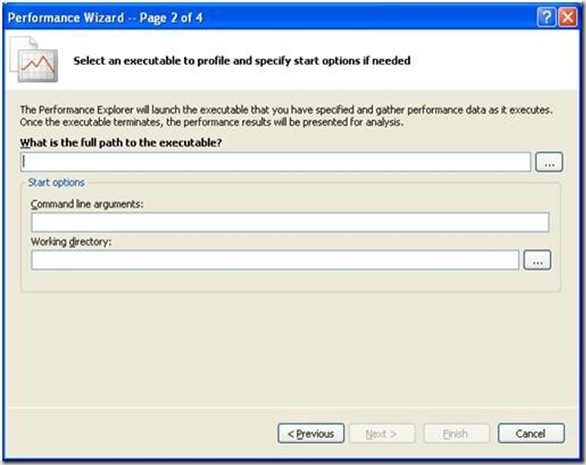
On Page 2, enter the fully qualified name of the target. See Figure 6. You can also search for the target with the browse button (i.e., “...”). Optionally, you can enter Command line arguments or the Working directory.
Figure 6
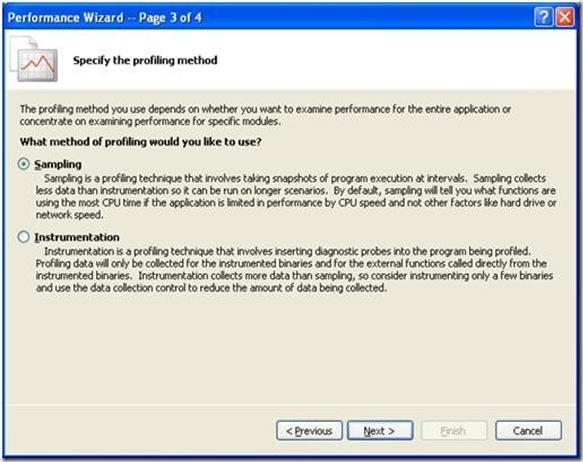
On Page 3 of the wizard, you select the profiling method: Sampling or Instrumentation. See Figure 7. Don’t worry: this is not a lifetime commitment. The method of data collection can be easily changed after the profiling session has been created.
Figure 7
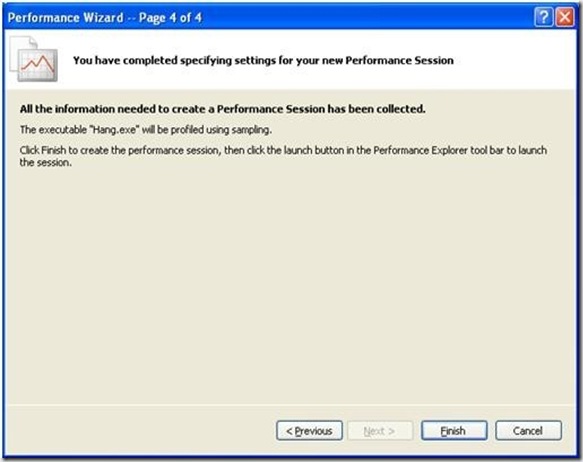
Page 4 is the confirmation page as shown in Figure 8. Confirm completion of the wizard (“Finish”) or return to previous pages to make changes.
Figure 8
If a project is already open, the Performance Wizard has three pages as a default, not four. You do not have to enter the name and path of the assembly. For that reason, that page is omitted.
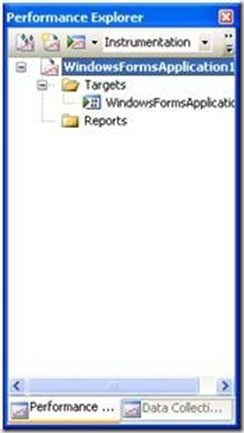
The Performance Explorer should appear when the Performance Wizard is finished. Use the Performance Explorer to manage the profiling session. In order, the buttons on the Performance Explorer toolbar are Launch Performance Wizard, New Performance Session, Launch with Profiling, Method (Instrumentation or Sampling), Stop, and Attach/Detach button. This is shown in Figure 9. Most importantly, start a performance session with the Launch with Profiling button.
Figure 9
You can profile multiple applications by simply adding additional applications to the Performance Explorer. The easiest way is to simply rerun the Performance Wizard. Each application will appear in the Performance Explorer as a separate target.
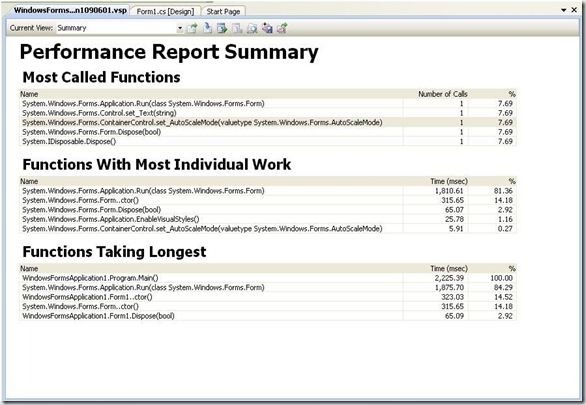
At the completion of a performance session, a Performance Report Summary is rendered. This appears within the *.vsp window. Figure 10 shows the report.
Figure 10
The report is in three sections:
- Most Called Functions This report lists functions by frequency, with the most frequently called functions listed first.
- Functions With Most Individual Work This report lists functions in order of performance, with the most expensive functions listed first.
- Functions Taking Longest This report lists functions in order of performance also. For this report, function performance also includes child functions, however.
These other views are also available:
- Call Tree
- Modules
- Caller/Callee
- Functions
- Marks
- Process
